How Playtika determined the best architecture for delivering real-time ML streaming endpoints at scale
By Avi Gabay, Director of Architecture at Playtika
Machine learning (ML) has been one of the fastest growing trends in the industry. Many companies spend time and money on marketing campaigns to show how they use ML for business automation and insights that in turn creates a winning product that beats out their competitors. Of course, there are few companies that actually produce and work on machine learning models that shape their user experience (and in real-time).
Playtika’s Artificial Intelligence Research is where all the magic of data science research occurs in order to produce real time game decisions to allow a better game play experience for our users. Playtika is a Game-Entertainment company that provides audiences around the world with a wide variety of games based on quality, and original content that is constantly changing and tailored to each player specifically. Playtika uses massive amounts of data to reshape the gaming landscape by tailoring user experience based on in-game actions. With over 30 million monthly active users (MAU), 10 billion daily events and over 9TB of daily processed data, Playtika is able to provide its scientists the data they need to create a continuously changing and adaptive game environment for its users based on their ingame behavior.
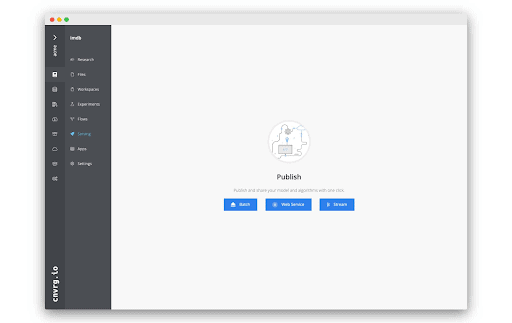
As the demand to answer business needs with machine learning models increased, the Brain Engineering teams found themselves in need of a robust infrastructure that scales horizontally and can handle bursts, peaks, and fast creation of new ML Pipelines. We’ve held a lot of thought about how we can handle our experiments, scaling and deployments, and found a new home-grown (Israeli) startup, built by experienced data scientists that answered our needs: meet cnvrg.io. cnvrg.io is an AI OS designed and built to organize every stage of a data-science project, including research, information collection, code writing, and model optimization at scale. cnvrg.io unified our ML workflow, and provided an MLOps solution so that our team could focus more on delivering high impact machine learning models and creating value for our business and users.
Using cnvrg.io’s MLOps solutions, we were able to decouple most of the work between our Data Scientists and ML Data Engineers. Being able to continuously write, train and deploy machine learning models to various stages (i.e. training, staging, production) in the click of a button, cnvrg.io was the answer to our processes and needs from research to production. It has all the tools provided by world known frameworks such as Amazon SageMaker, Mlflow, Kubeflow and others, in a user friendly interface, with features including data version control and management, experiment tracking, model management, model monitoring and deployment. Once our models were trained, curated and verified they were pushed to production on top of our Kubernetes Cluster ready to receive RESTful API requests for predictions and inferences. Being able to easily deploy ML models was great, but we found out that our models used various types of processes. Some models were triggered by batch processes, where once a day a scheduled Airflow task called for a Spark Process which would gather features for millions of players and then send requests for the model to predict. Other models had Kafka consumer processes that were triggered by in-game events which would then call the model for inferences. We’ve seen that as Playtika’s DAU grows and business pushes more player traffic to our models, we cannot always predict our peaks and that we suddenly need to handle request failure, batch partitioning and so on. We came to the understanding that just as the world of software moved from RESTful services to Streaming APIs, so should the world of ML.
Problems Encountered
At a higher level, the main issues we encountered with REST APIs in our ML Pipelines can be summarized under the following three categories:
- Service exhaustion
- Client starvation
- Handling failures and retries
- Performance tuning of bulk size for batch partitioning
As our batch processes gather millions of users and hundreds (if not thousands) of features, we could not send a single bulk request to a machine learning model over REST API and expect it to return in a reasonable amount of time (less than a few minutes – single digits). This is when our data engineers decided that it would be best to just split the batch into bulks of ~1000 Players (after doing some tuning on bulk size throughput). However, sending 1000 bulks in serial would just take too long, so we allowed parallelizing this process and therefore had multiple client threads sending requests. But, this in turn caused exhaustion of the models which introduced timeouts to the client making the call and leading for retry mechanism and the need for statistical analysis based on a dead letter queue. Client retries have created more traffic and more chaos, which lead to service exhaustion and client starvation, and what we like to call “self denial of service”.
This has led us to look into circuit-breakers and rate limiting and even architecture change. Those of you who have worked extensively with microservices have probably heard of bulkhead pattern which is a type of application design that is tolerant of failure. In a bulkhead architecture, elements of an application are isolated into pools so that if one fails, the others will continue to function. It’s named after the sectioned partitions (bulkheads) of a ship’s hull. If the hull of a ship is compromised, only the damaged section fills with water, which prevents the ship from sinking. However, partitioning our models per group of users or requestor ID is such a large overhead in design and deployment and therefore seems like an irrelevant solution for our problem.
Ideation
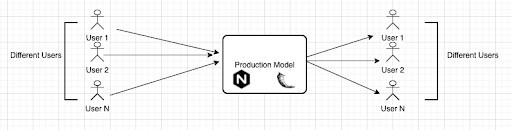
So, we decided that it would be best if we go back to the origins of our system architecture and key concepts of our game architecture. Playtika’s games have an event-driven service based backend. Some studios (games) have more than a couple hundred micro services deployed and communication between them is mostly performed using Kafka (our message bus). This in turn creates a system that is asynchronous (and therefore eventually consistent), fault tolerant, replayable and is highly scalable. We also know that our games and machine learning models never communicate directly using RESTful APIs. The basic reasoning behind it is that the most important parameter of our success is that the main game play and user experience will not be affected. All the extra “nice to have” features and insights are important, but our main goal is to keep the user excited, engaged and entertained as he keeps playing the game. Therefore all events from the game arrive at our Data Platform over public Kafka topics that are streamed to different layers of our systems including our Data Lake and Stream Processing Pipeline which decorates and normalizes the data to allow consumers such as Playtika Brain to run machine learning models. Moreover, the results of these models are pushed back to the game in the form of treatments (in game actions) or user state predictions through the same means – Kafka topics. Due to this event-driven ecosystem that Playtika has built, it only made sense to introduce streaming prediction pipelines ourselves.
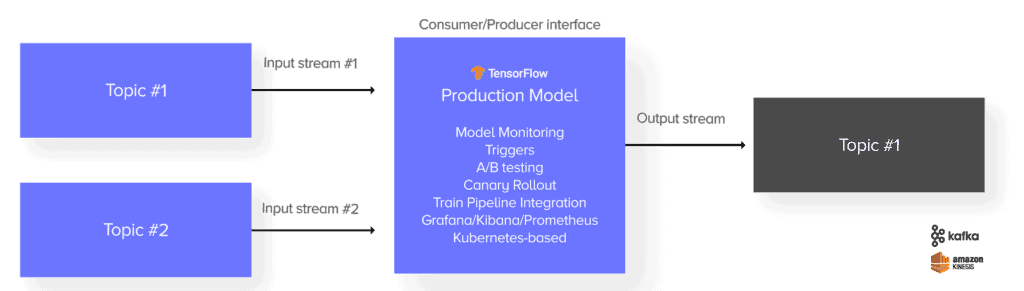
This is when we jumped on a call with cnvrg.io and discussed the possibility to package our models not only using REST API, but rather use Kafka Streams for incoming requests and outgoing inferences. For those of you who are not familiar with Kafka Streams, Kafka Streams is a client library for building applications and microservices, where the input and output data are stored in Kafka clusters. It addresses many hard problems that we encounter when using batch and REST API approach.
- Event-at-a-time processing (not microbatch) with millisecond latency
- Exactly once processing
- Distributed processing and fault-tolerance with fast failover
- Reprocessing capabilities so you can recalculate output when your code changes
Besides the great capabilities that Kafka Streams solves, stream processing itself allows us to gain better model computing performance. Since Playtika is event-driven, we usually look at throughput rather than latency. We do acknowledge that latency is important, especially in our front-end services, but many of our backend services explicitly look at the amount of messages they can handle rather than the latency for a single request. Moving to stream processing allowed us to bring our Kubernetes Pods to their most optimal deployment. We make sure that every Pod is deployed such that the amount of application threads that are running on the Node is at most N-1 where N is the number of CPUs on that node. As our models perform very little I/O and are only compute bound, we therefore want as little context switches as possible and want to make sure that every thread runs and utilizes a single CPU. So why N-1 and not N you ask? Well, we do want our beloved operating system to have its own processing unit. Therefore, by using stream processing we are able to increase our usage and performance of the underlying CPUs allowing for greater throughput.
Testing and PoC
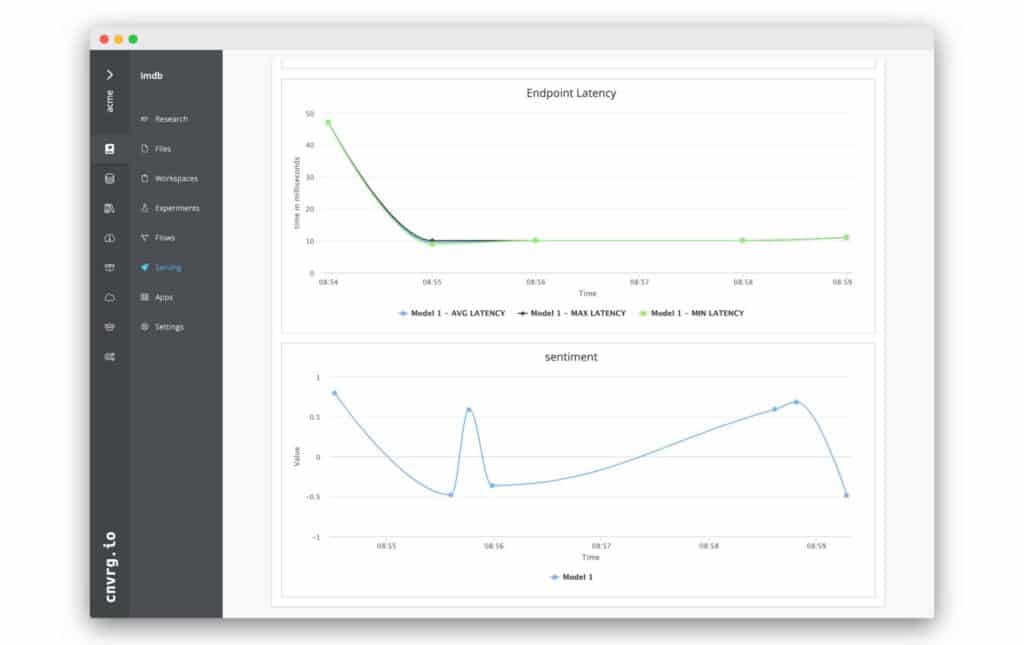
With all these thoughts in mind, we decided to put them into trial. This is exactly the point when our conversation with cnvrg.io got interesting and as soon as the streaming feature was in development phase we held a quick PoC with cnvrg.io which has led to the results below.
We took a trained IMDB sentiment analysis model and deployed it in two forms. The first was using a Pod containing Nginx and Flask while the second was using a Pod containing a Kafka Streams application.
Deployment Architecture
The experiment was made on top of AWS. Each model ran on its own dedicated EC2 m5.large instances (2 CPUs, 8GB RAM).
REST API
The REST service (model) is a Flask microservice deployed to a uWSGI server that resides behind an nginx.
Kafka Streams
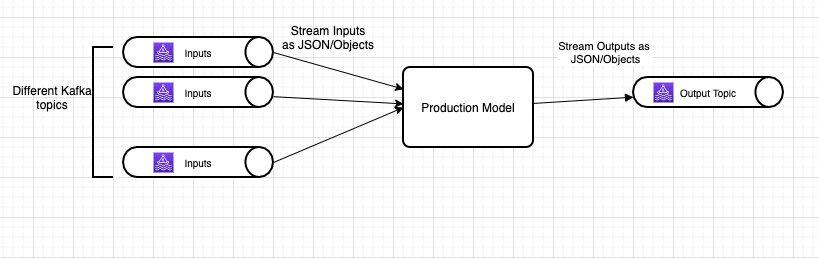
The Stream microservice is a daemon service that uses faust, a python stream processing library, to consume data from a Kafka topic and output the results to an output topic.
Results
The actual result parameters can be seen in the appendix section, where all graphs and tables are found.
Throughput
From the results below we discover that by using Kafka Streams we are able to increase our model throughput by up to 50% and on average by 30% when comparing to RESTful APIs. It should be noted that when looking at throughput we should look at successful throughput. This is the number of successful requests sent (ones that returned HTTP status code of 200) divided by the total number of seconds the test ran for. Due to the fact that there are failures in calculations (mostly caused by HTTP timeouts) we don’t only “lose” the requests sent, we may need to replay them as retries and create even more traffic that is coming at the model.
Another observation is that Kafka Streams microservice throughput does not diverge much over time. There’s a divergence of 0.5TPS where in the webservice it reaches over 5TPS. The uniformity in throughput over time allows us to evaluate and plan the performance and scaling of our model.
Errors
Due to the fact that Kafka Streams is fault tolerant and enables exactly once processing, there are no errors in our experiment. This does not mean that Kafka has no issues and can fail, however, in its basis it was designed to be highly available and transport billions of records. It is able to handle bursts and therefore the number of errors will always be minimal. Moreover, Kafka Streams is designed to allow exactly once processing and therefore we know that we will not cause message duplications.
When observing REST API results (as seen in Graph-1) we see an increase in error rate after the first minute which keeps on diverging based on the load of the model instance. The client is exhausting the webservice which causes a slow down in model throughput which leads to greater latency and errors. It is clearly seen that latency and error rate correlate positively while with each other, while throughput correlates negatively with both.
Conclusion
After deep analysis of our model run-time, we were able to see that moving to streaming technologies such as Kafka Streams has not only increased our model throughput during peak times, but has made our capacity planning more determinate and predictable. We are now able to handle peaks and failures without having to create satellite systems or write code to handle failures and edge cases. We have come with a rule of thumb that “all asynchronous predictions can be turned into streams when calculations are independent and discrete”. This means that when prediction for events arriving from different players (entities) are unsusceptible (independent) and that events of the same player (entity) do not need to be grouped together (discrete), streaming technology can be applied. An example use case which this definition does not apply to is clustering problems where events must be grouped together and any kind of re-grouping will affect the label (target result).
REST API
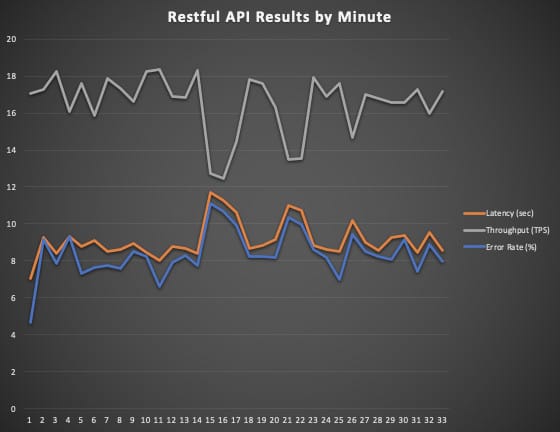
Table-1
Restful API Results by Minute | |||||
Minute | Requests | Latency Avg (seconds) | Throughput | Erroneous | Error Rate |
1 | 1025 | 7.04 | 17.08 | 48 | 4.68 |
2 | 1036 | 9.27 | 17.27 | 95 | 9.17 |
3 | 1094 | 8.39 | 18.23 | 86 | 7.86 |
4 | 966 | 9.3 | 16.1 | 90 | 9.32 |
5 | 1055 | 8.76 | 17.58 | 77 | 7.3 |
6 | 952 | 9.1 | 15.87 | 73 | 7.67 |
7 | 1073 | 8.51 | 17.88 | 83 | 7.74 |
8 | 1039 | 8.61 | 17.32 | 79 | 7.6 |
9 | 999 | 8.95 | 16.65 | 85 | 8.51 |
10 | 1096 | 8.44 | 18.27 | 90 | 8.21 |
11 | 1101 | 8.04 | 18.35 | 73 | 6.63 |
12 | 1013 | 8.78 | 16.88 | 80 | 7.9 |
13 | 1012 | 8.68 | 16.87 | 84 | 8.3 |
14 | 1098 | 8.4 | 18.3 | 85 | 7.74 |
15 | 765 | 11.7 | 12.75 | 85 | 11.11 |
16 | 748 | 11.26 | 12.47 | 80 | 10.7 |
17 | 869 | 10.63 | 14.48 | 86 | 9.9 |
18 | 1068 | 8.65 | 17.8 | 88 | 8.24 |
19 | 1055 | 8.83 | 17.58 | 87 | 8.25 |
20 | 977 | 9.18 | 16.28 | 80 | 8.19 |
21 | 810 | 10.97 | 13.5 | 84 | 10.37 |
22 | 811 | 10.71 | 13.52 | 81 | 9.99 |
23 | 1077 | 8.85 | 17.95 | 93 | 8.64 |
24 | 1013 | 8.62 | 16.88 | 83 | 8.19 |
25 | 1057 | 8.52 | 17.62 | 74 | 7 |
26 | 882 | 10.18 | 14.7 | 83 | 9.41 |
27 | 1020 | 8.98 | 17 | 87 | 8.53 |
28 | 1007 | 8.57 | 16.78 | 83 | 8.24 |
29 | 993 | 9.24 | 16.55 | 80 | 8.06 |
30 | 994 | 9.38 | 16.57 | 91 | 9.15 |
31 | 1036 | 8.47 | 17.27 | 77 | 7.43 |
32 | 959 | 9.53 | 15.98 | 85 | 8.86 |
33 | 1029 | 8.55 | 17.15 | 82 | 7.97 |
Graph-2
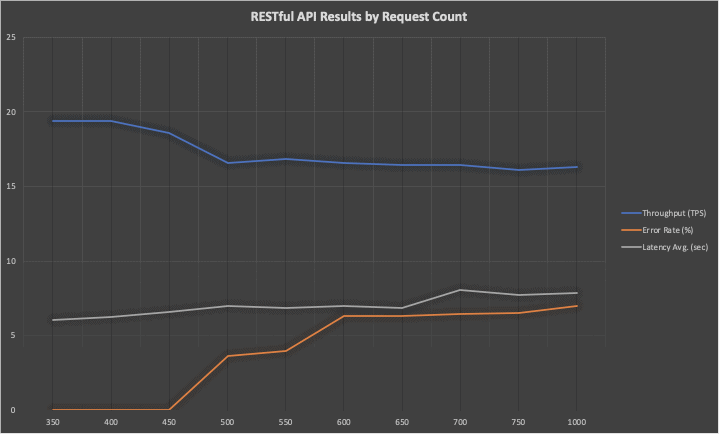
Table-2
RESTful API Results by Request Count | ||||
Requests | Total Time (seconds) | Throughput (TPS) | Latency Avg. (seconds) | Error Rate |
350 | 18.03 | 19.41 | 6.03 | 0 |
400 | 20.61 | 19.40 | 6.24 | 0 |
450 | 24.21 | 18.58 | 6.57 | 0 |
500 | 30.21 | 16.55 | 6.96 | 3.6 |
550 | 32.70 | 16.81 | 6.84 | 4 |
600 | 36.24 | 16.55 | 6.98 | 6.33 |
650 | 39.53 | 16.43 | 6.87 | 6.30 |
700 | 42.61 | 16.42 | 8.07 | 6.42 |
750 | 46.52 | 16.12 | 7.74 | 6.53 |
1000 | 61.03 | 16.31 | 7.83 | 7 |
Stream Results
Graph-3
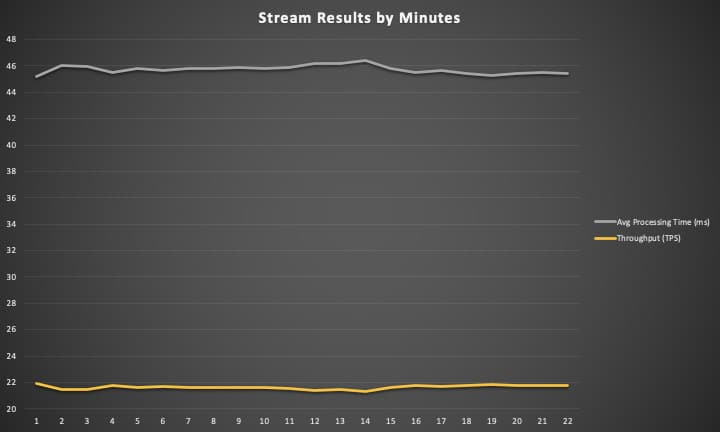
Table-3
Stream Results by Minute | |||
Minute | Requests | Processing Time | Throughput |
1 | 1313 | 45.20 | 21.88 |
2 | 1289 | 46.02 | 21.48 |
3 | 1290 | 45.99 | 21.50 |
4 | 1304 | 45.53 | 21.73 |
5 | 1297 | 45.80 | 21.62 |
6 | 1300 | 45.65 | 21.67 |
7 | 1297 | 45.79 | 21.62 |
8 | 1296 | 45.80 | 21.60 |
9 | 1295 | 45.85 | 21.58 |
10 | 1297 | 45.79 | 21.62 |
11 | 1294 | 45.85 | 21.57 |
12 | 1285 | 46.21 | 21.42 |
13 | 1286 | 46.20 | 21.43 |
14 | 1278 | 46.41 | 21.30 |
15 | 1297 | 45.77 | 21.62 |
16 | 1305 | 45.49 | 21.75 |
17 | 1300 | 45.68 | 21.67 |
18 | 1308 | 45.39 | 21.80 |
19 | 1310 | 45.30 | 21.83 |
20 | 1306 | 45.45 | 21.77 |
21 | 1305 | 45.54 | 21.75 |
22 | 1306 | 45.44 | 21.77 |