My first AI Blueprints tutorial went over the types of recommendation systems and how to create a recommendation system using a Blueprint without writing model code. One of the lessons learned was how easy it was to create and scale a ML pipeline. AI Blueprints can not only be used to create recommendation systems, but can also be used for NLP, computer vision, anomaly detection and more. This particular tutorial will go over:
What is sentiment analysis
How to use AI Blueprints to pull live Twitter data and analyze its sentiment without writing code
What is Sentiment Analysis
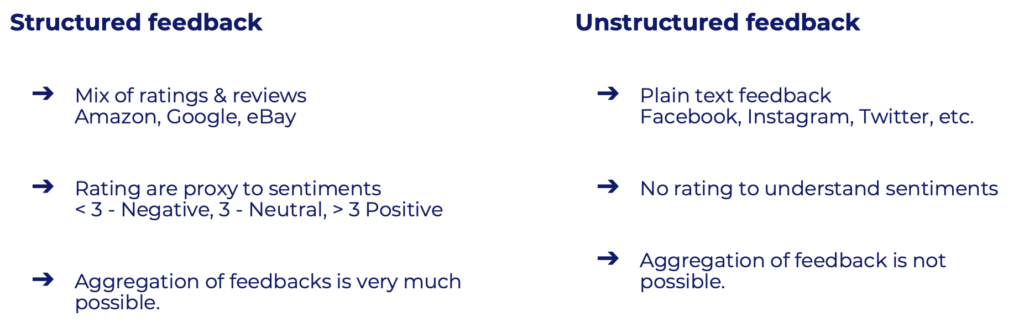
According to Wikipedia, sentiment analysis is the use of natural language processing, text analysis, computational linguistics, and biometrics to systematically identify, extract, quantify, and study affective states and subjective information. It can be used to improve customer experience, reduce employee turnover, build better products, and much more. The data used for sentiment analysis can come in many different forms. For instance, customer feedback typically comes in two different forms: structured and unstructured.
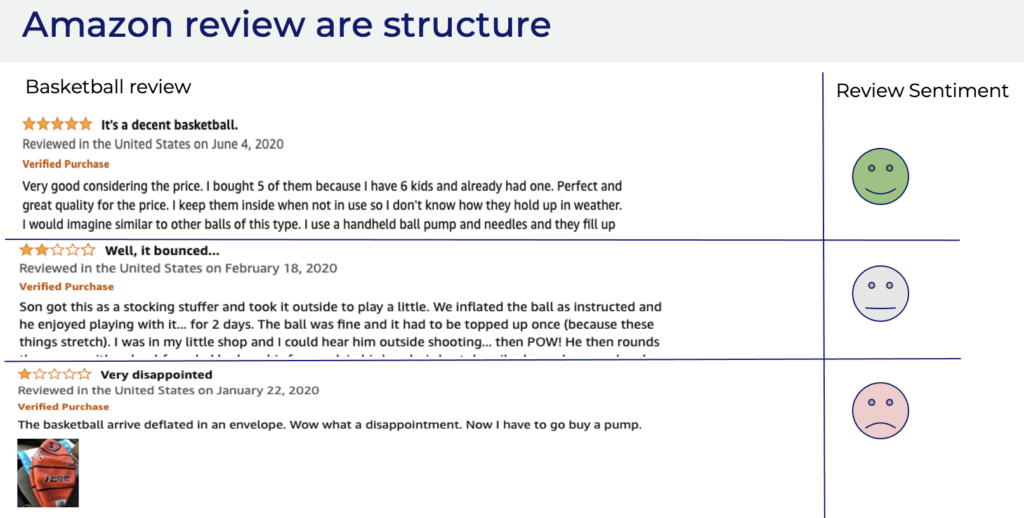
For example, Amazon reviews are structured as ratings are a good proxy for customer sentiment.
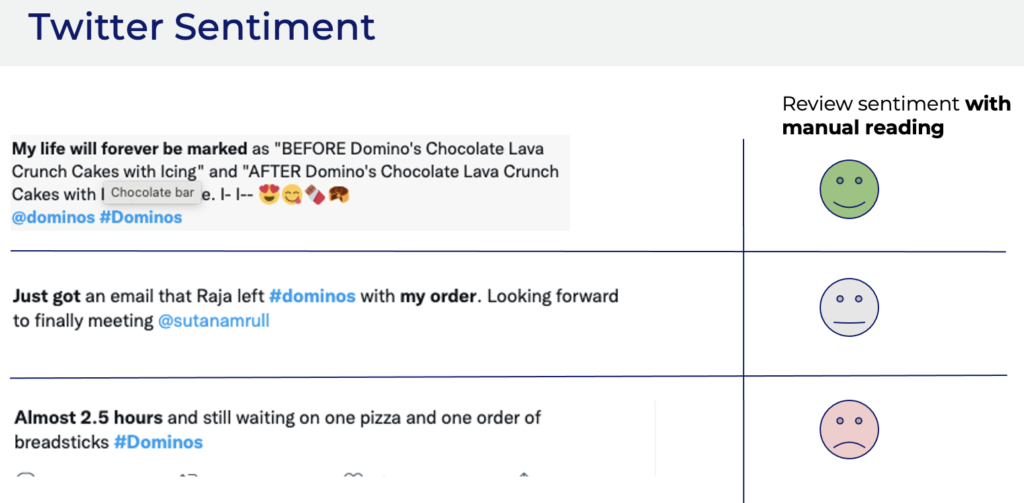
However, a lot of the data in the world is unstructured. For example, Twitter data doesn’t come with a rating.
Using AI Blueprints to analyze Twitter sentiment without writing code
In this tutorial, we will use sentiment analysis to identify the emotion behind Twitter data. Specifically we will look at whether a particular hashtag #MayTheFourth (Star Wars Day contains positive, negative, or neutral sentiment. In order to access Twitter data, you will need a Twitter Developer Account which you can learn to set up here. Note that if you want to do sentiment analysis on your own data, you will need labeled data of texts and their matching sentiment which this tutorial doesn’t cover.
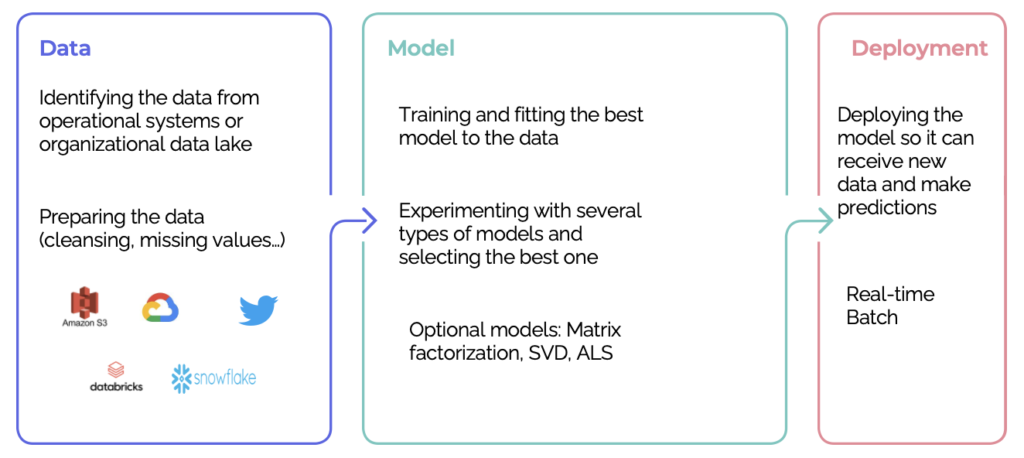
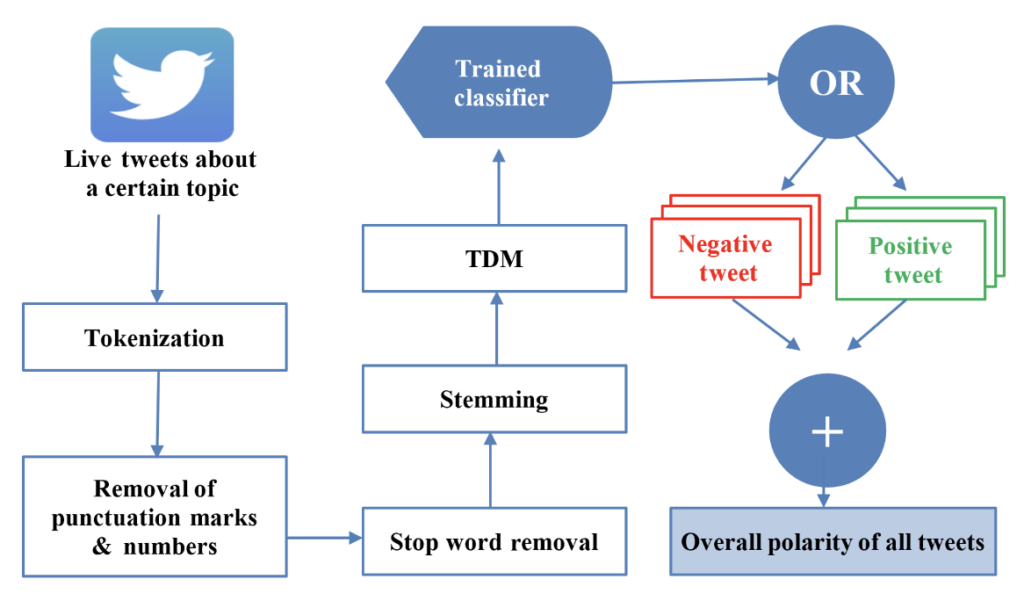
Below is a general sentiment analysis process which AI blueprints does behind the scenes.
Our business case for this tutorial is to evaluate overall Twitter sentiment for a given topic (hashtag) which you can see in the image below. Naturally, this can be complicated.
Fortunately, our AI Blueprint will take care of all this data processing and will give the overall tweet polarity in a single click.
Selecting the Blueprint
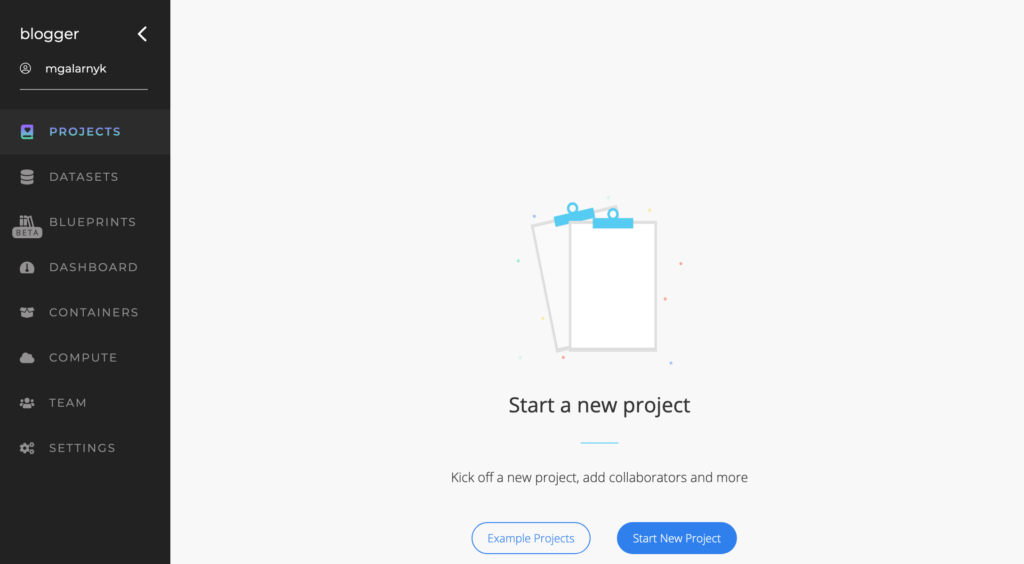
To be able to follow along with this part of the tutorial, you will need to sign up or login to cnvrg.io Metacloud. Once you’ve created a user name, you will get a screen similar to the one below.
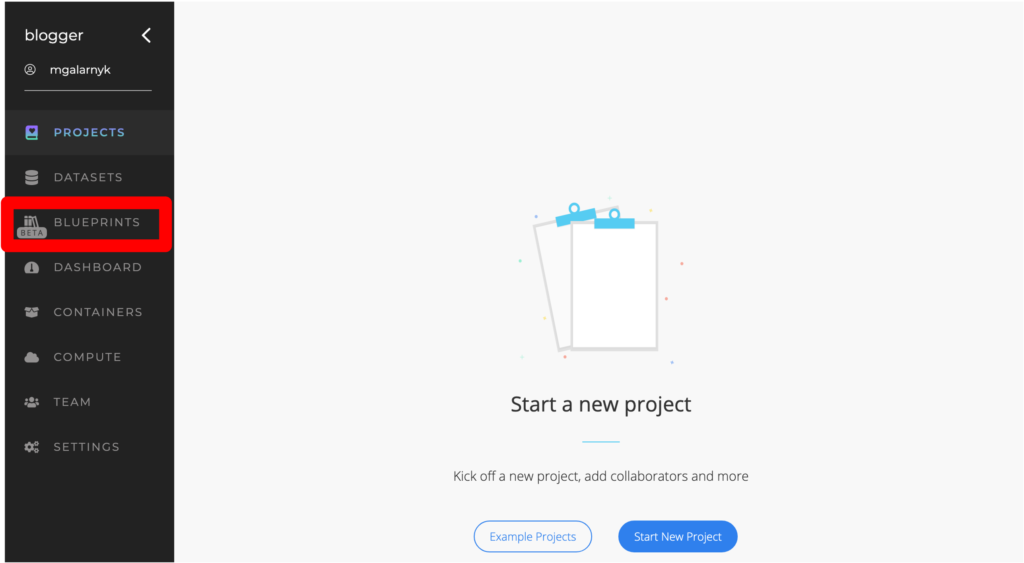
The next step is to select Blueprints.
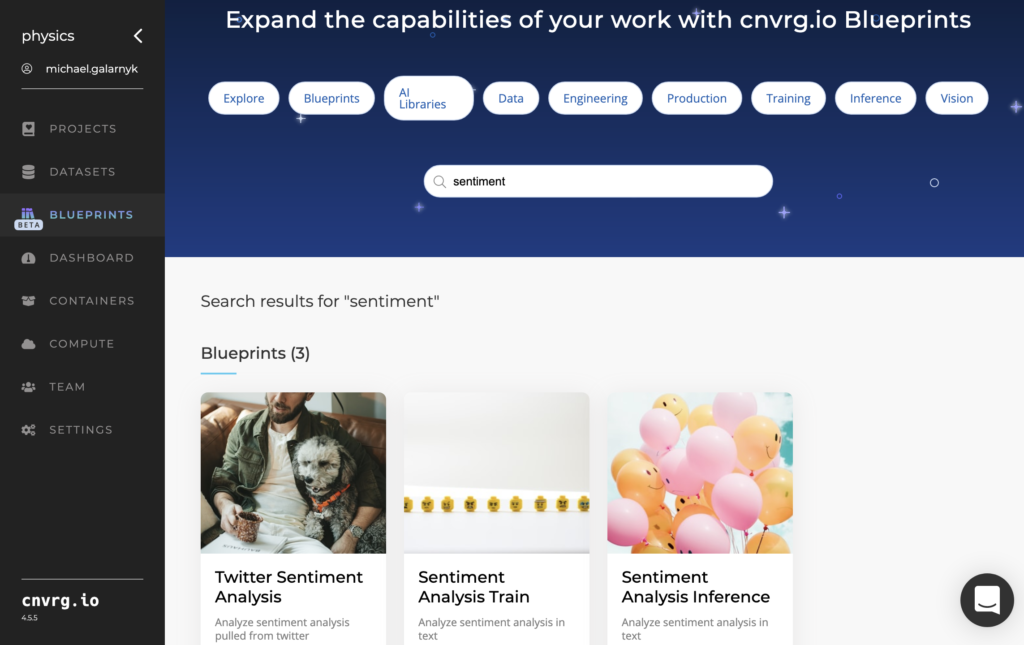
Next type in sentiment.
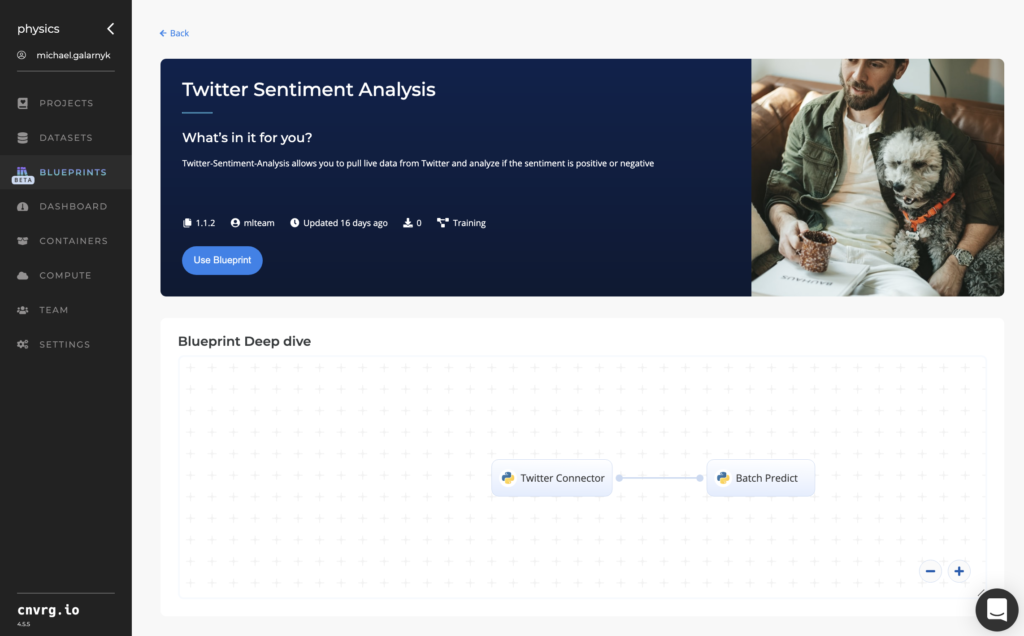
Click on Twitter Sentiment Analysis.
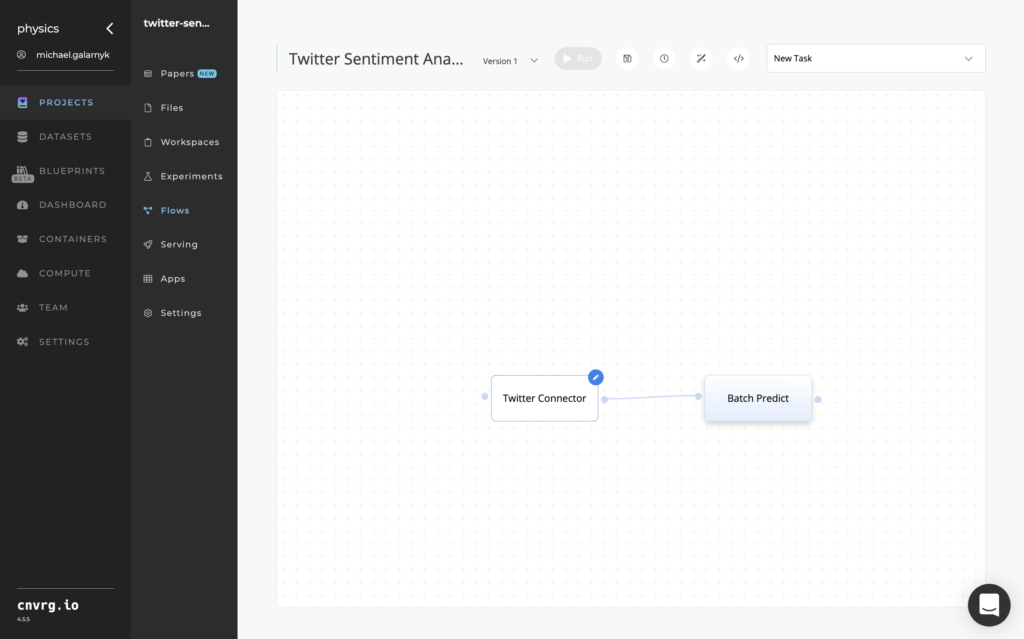
Next, click on Use Blueprint and you will see a flow diagram.
This blueprint consists of the following components:
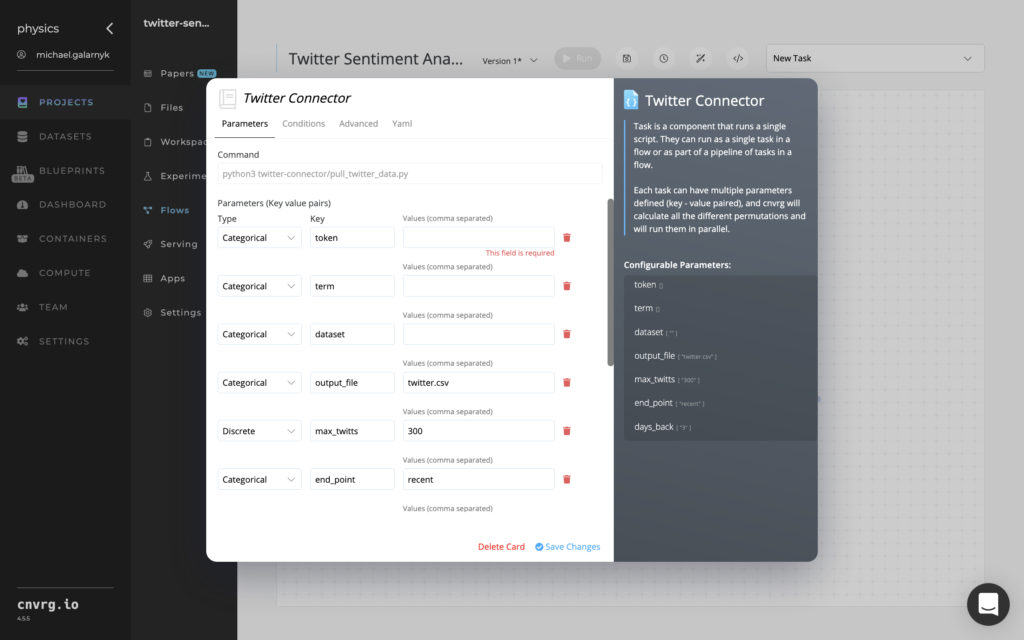
Twitter Connector: This connector enables you to input your Bearer token and the hashtag you are interested in. We will make the output of this a csv file. If you aren’t sure what a Bearer token is and how to get it, please see this cnvrg.io community post on the Twitter API.
Batch Predict: In this blueprint, the csv file from the Twitter Connector will be fed into a pretrained model in Batch Predict which will make predictions. These predictions consist of positive or negative sentiment as well as the sentiment score.
term: This is the hashtag you are interested in. In this tutorial, we are interested in Star Wars Day (MayTheFourth).
dataset: I named it twittdata. This is mostly for organizational purposes.
output_file: This is the output file name which holds all the data for our term (hashtag). Batch Predict will need to read this file. In this tutorial, we named it twitter.csv.
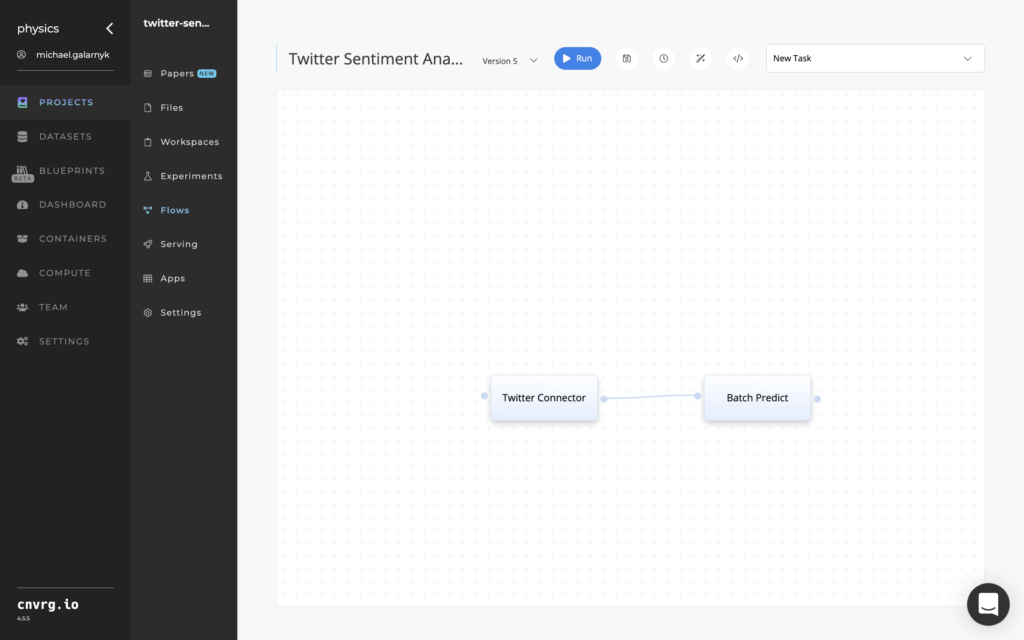
Note that there are other values that you can input as well like max_twitts (how many tweets you want up to) and days_back (from how many days ago do you want the tweets). Click on Save Changes. Twitter Connector in the flow diagram should now look filled in.
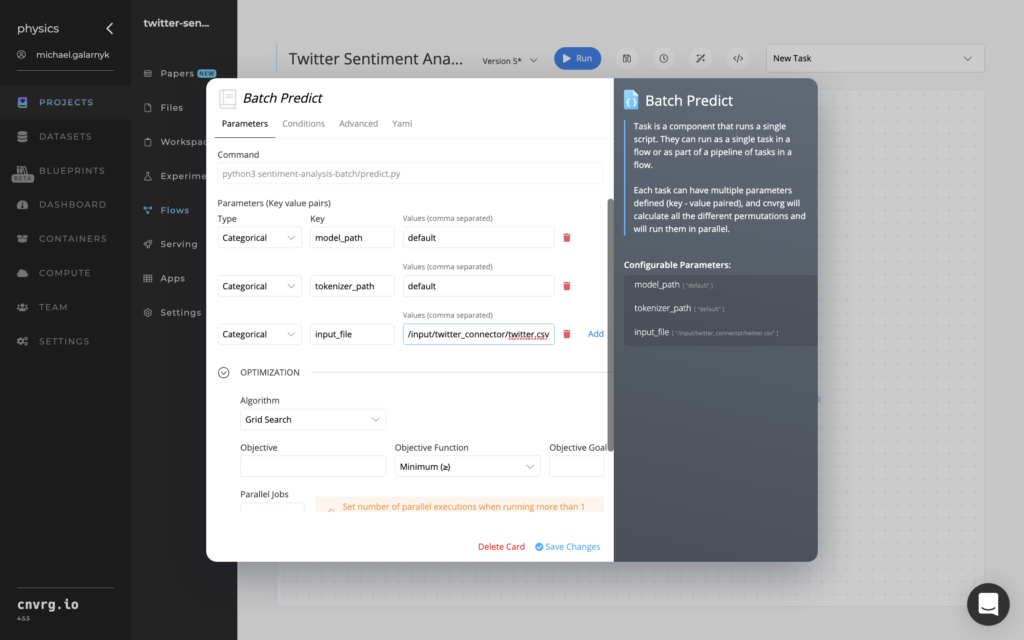
Batch Predict
Click on Batch Predict.
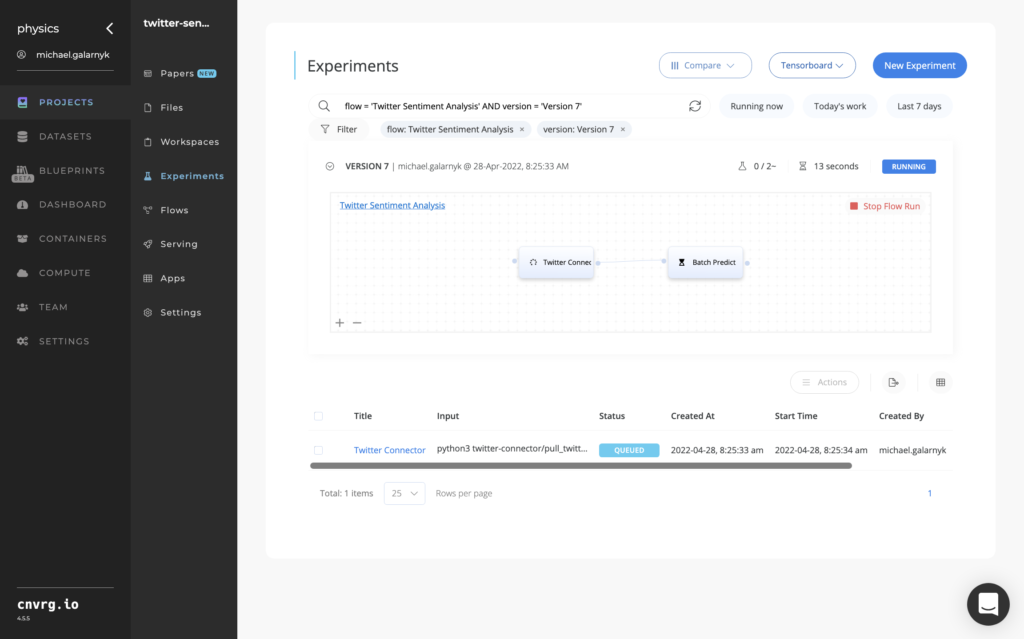
We won’t need to input values here. Note that the input_file name needs to be the same as the output_file from the Twitter Connector. Click on Save Changes and then click on Run.
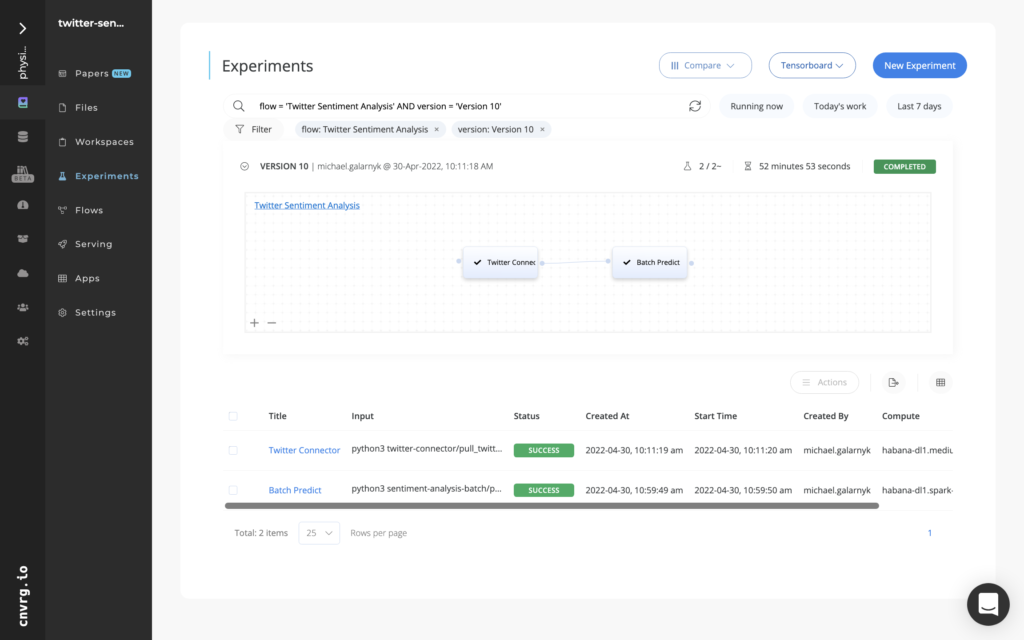
Depending on the resources allocated, it might take some time to run. If you see completed, you have successively made a sentiment analyzer!
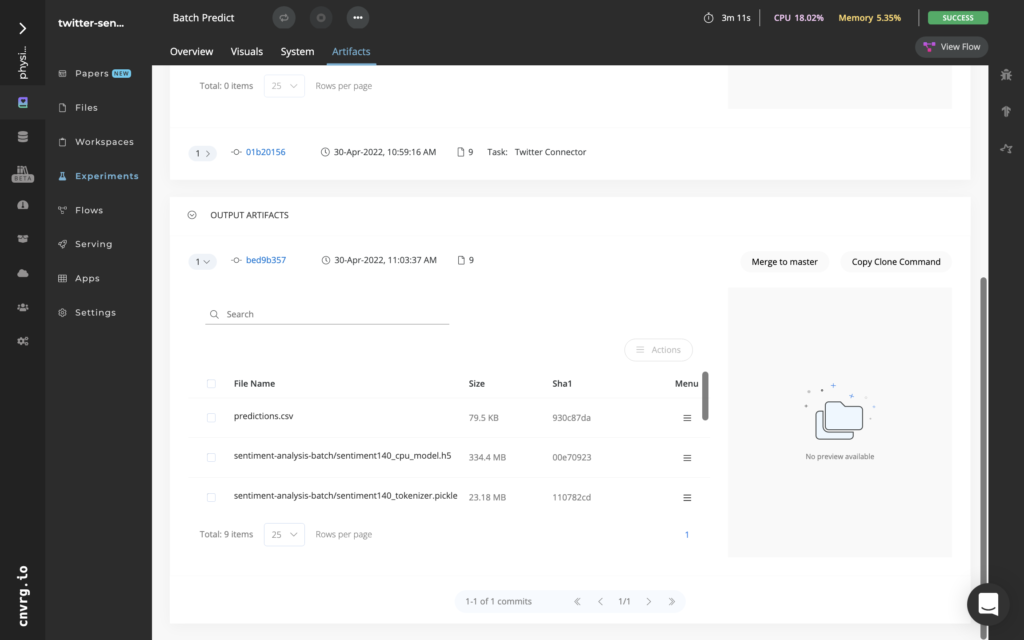
While this is great, you probably want to see the results (predictions.csv).
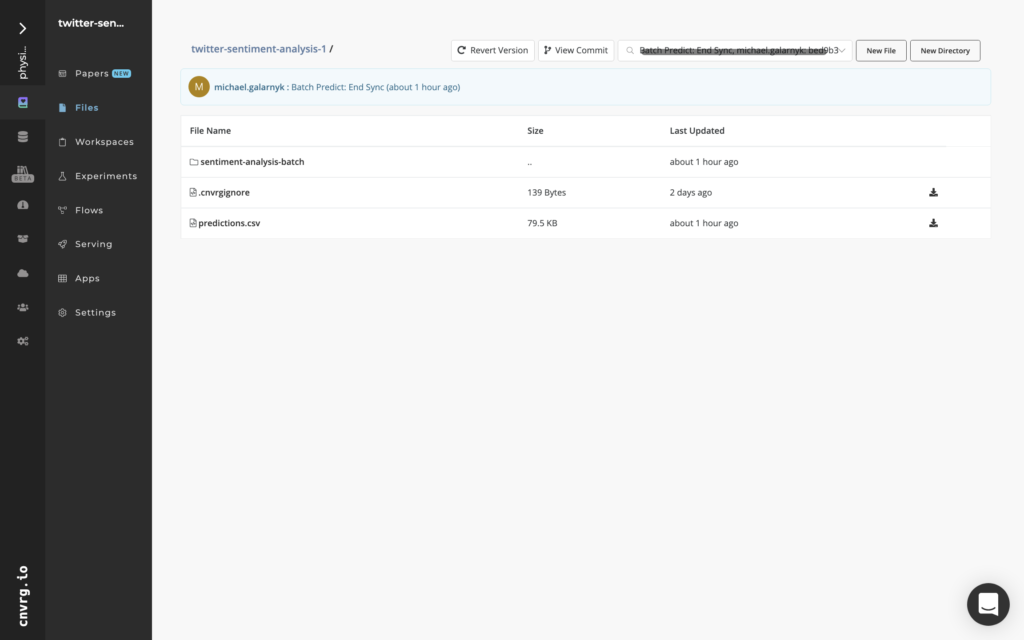
View Results
In order to view the results, click on Batch Predict and then Artifacts and scroll to the bottom. You will see predictions.csv. I recommend that you click on the commit (bed9b357 in the image below).
I recommend that you click on the commit (bed9b357 in the image above).
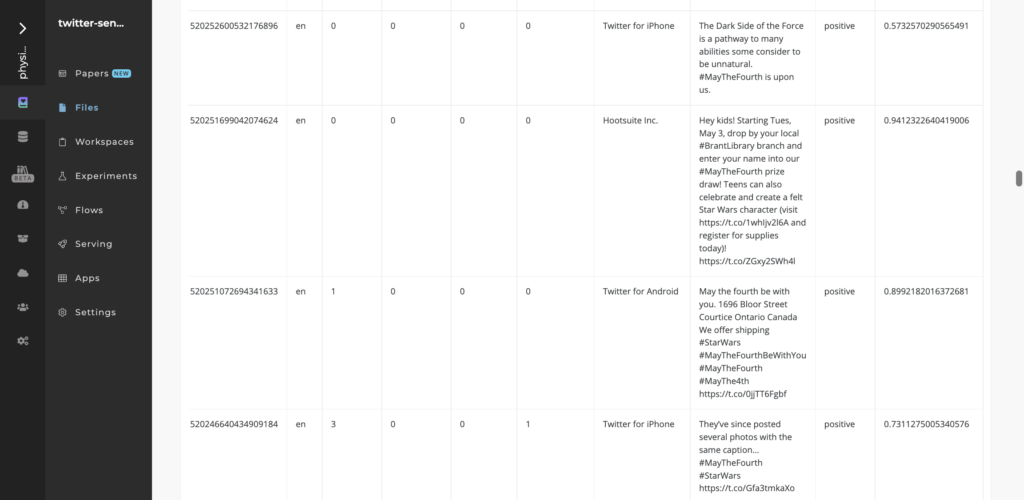
Next click on predictions. You will be able to see Sentiment and Score.
Conclusion
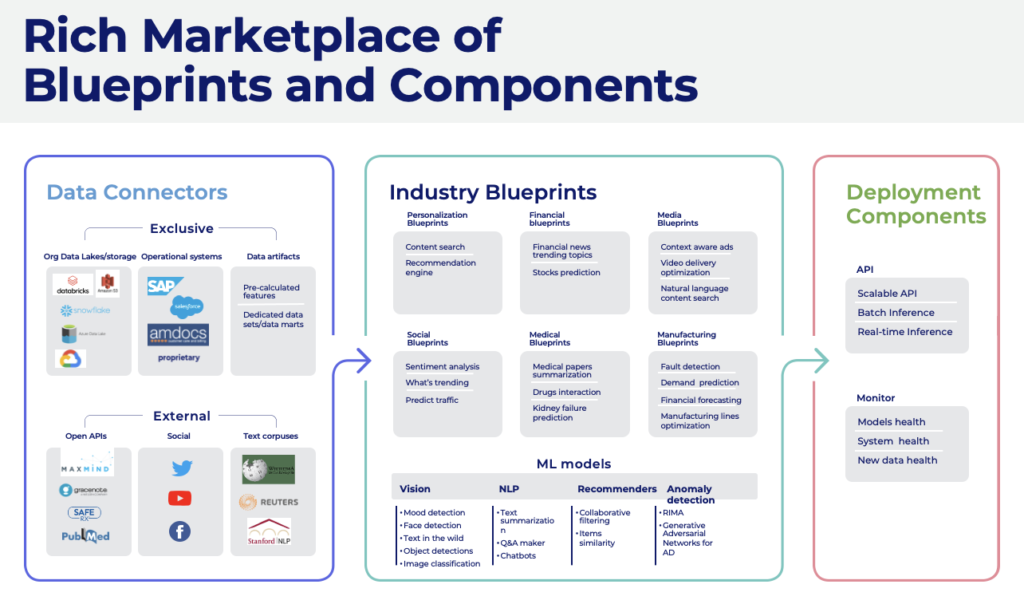
There is an ever expanding marketplace of blueprints and components for a variety of AI applications.
This post went over Twitter Sentiment Analysis with AI Blueprints. Keep in mind that it is very easy to do other amazing things with AI Blueprints like recommender systems, text summarization, computer vision, and much more. If you would like to share what you have done with AI Blueprints, you can post about it in the cnvrg.io community or @cnvrg_io on twitter.
This tutorial is based on a cnvrg.io workshop. You can watch the video from the workshop here.
Top MLOps guides and news in your inbox every month