While you could write your machine learning code in a text editor, an IDE—Integrated development environment — is preferred for multiple reasons. An IDE increases the productivity of a programmer by providing tools that enable them to:
- edit source code
- debug the code
- run the code
IDEs are also able to detect the programming language being used and provide visual cues. They also offer code completion, which can save you tons of time. PyCharm is one such IDE for Python. In this article, we’ll take a deep dive into PyCharm and how you can use it to improve your Python development process.
How to Install PyCharm
You can install PyCharm from its official page on Jetbrains. Click on the download button to download a version compatible with your operating system.

After the installation is complete, open it so that we can start exploring the IDE.

The image below shows the first page that you will see after accepting the required terms.

How to customize the PyCharm theme and color scheme
It is possible that you won’t like the default theme that ships with PyCharm. In that case, you can adjust it by clicking customize on the left.
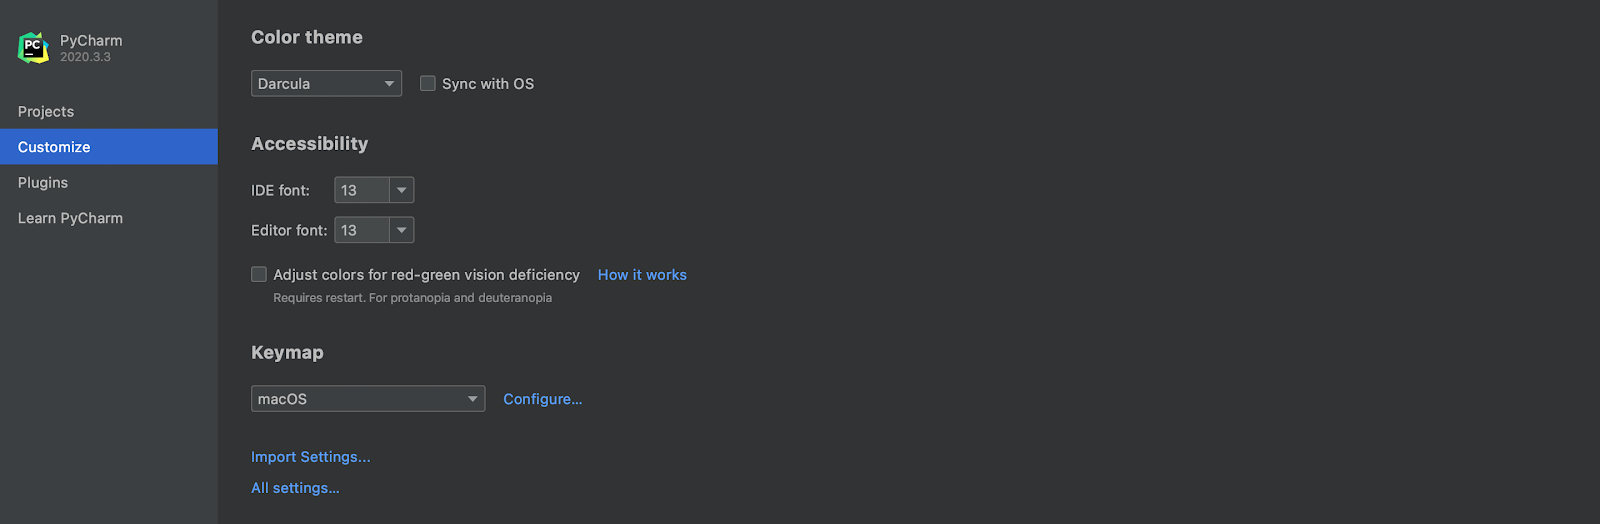
This gives you a couple of options, including syncing with your operating systems theme. Play around with the given options to see if any of them pleases you.

What if you don’t like any of them? That’s where plugins come in.
Customize the PyCharm theme using plugins
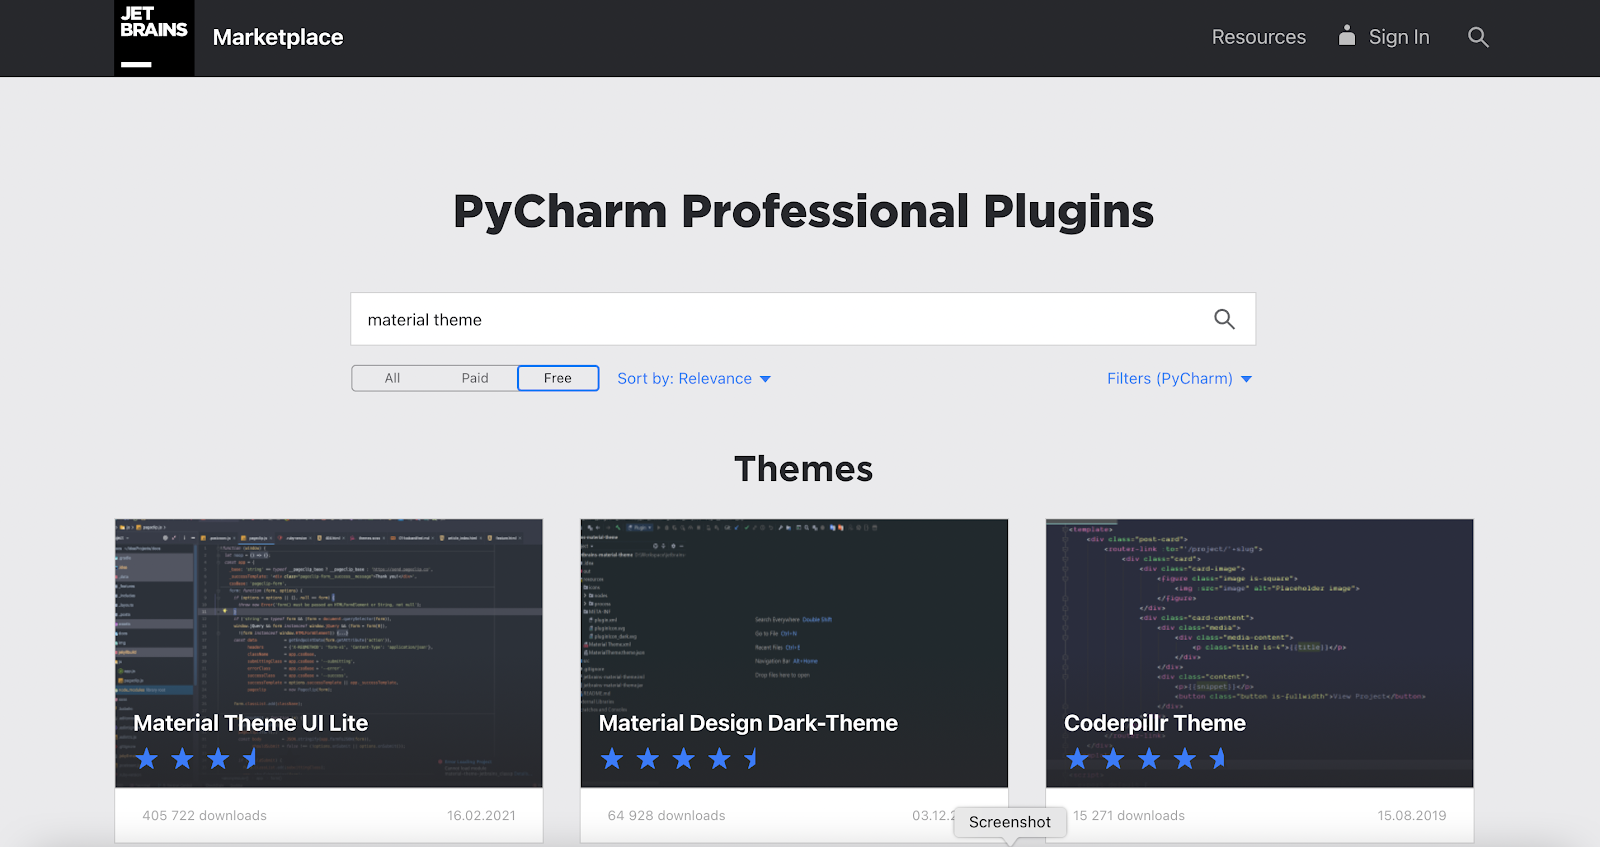
You can install some of the free or paid themes from the Jetbrains plugins repository. The first step is to visit the repo and identify a theme that you would like to use. Ensure that you have PyCharm selected and then search for a theme.

For instance, let’s search for a material theme. Notice that you have the option to select between free and paid plugins.
Click on the preferred theme to install it. You can see that it gives you the option to install it to PyCharm. Just click on that to install it.

You will then get a pop-up window. All you have to do now is click on OK to install the plugin.

You will get a third-party privacy notice. Press Accept to install the plugin if you are okay with the third party processing your data.

Alternatively, you can click on the Plugins button that is below the Customize button. Next, search for the theme and click Install to install it. You can install other plugins that are not themes in a similar manner.

How to run Python code in PyCharm
Before you can start writing some code, you need a project. Clicking on the Projects button on the left will give you the option to:
- create a new project
- open an existing project
- get a project from a version control system; more on this later

Click on New Project to start a new project. Let’s kick off with a Pure Python project.

If you are working on an Intel machine, use the default options and create a new environment. If you are on the new Apple Silicon computers, you can proceed with the default options, but you should be aware that TensorFlow will not work. As of this writing, there is no pip installable TensorFlow version that works on the new 2020 Macs. If you are using the new Macs, you will have to use this procedure to get the TensorFlow version that will work on Mac. Since the procedure uses Miniforge–a minimal version of Anaconda–you will have to select Previously Configured Interpreter and choose the environment you created when installing TensorFlow.

Click the three dots at the end to select the `conda` environment.

Select the` conda` environment and click Ok.

Now click Create on the last window to start the project.

This will create a new project with a default main.py file. You can also see the Tip of the Day. You can leave it turned on so that you can keep getting PyCharm tips. Clicking on the Don’t Show Tips checkbox will disable the tips.

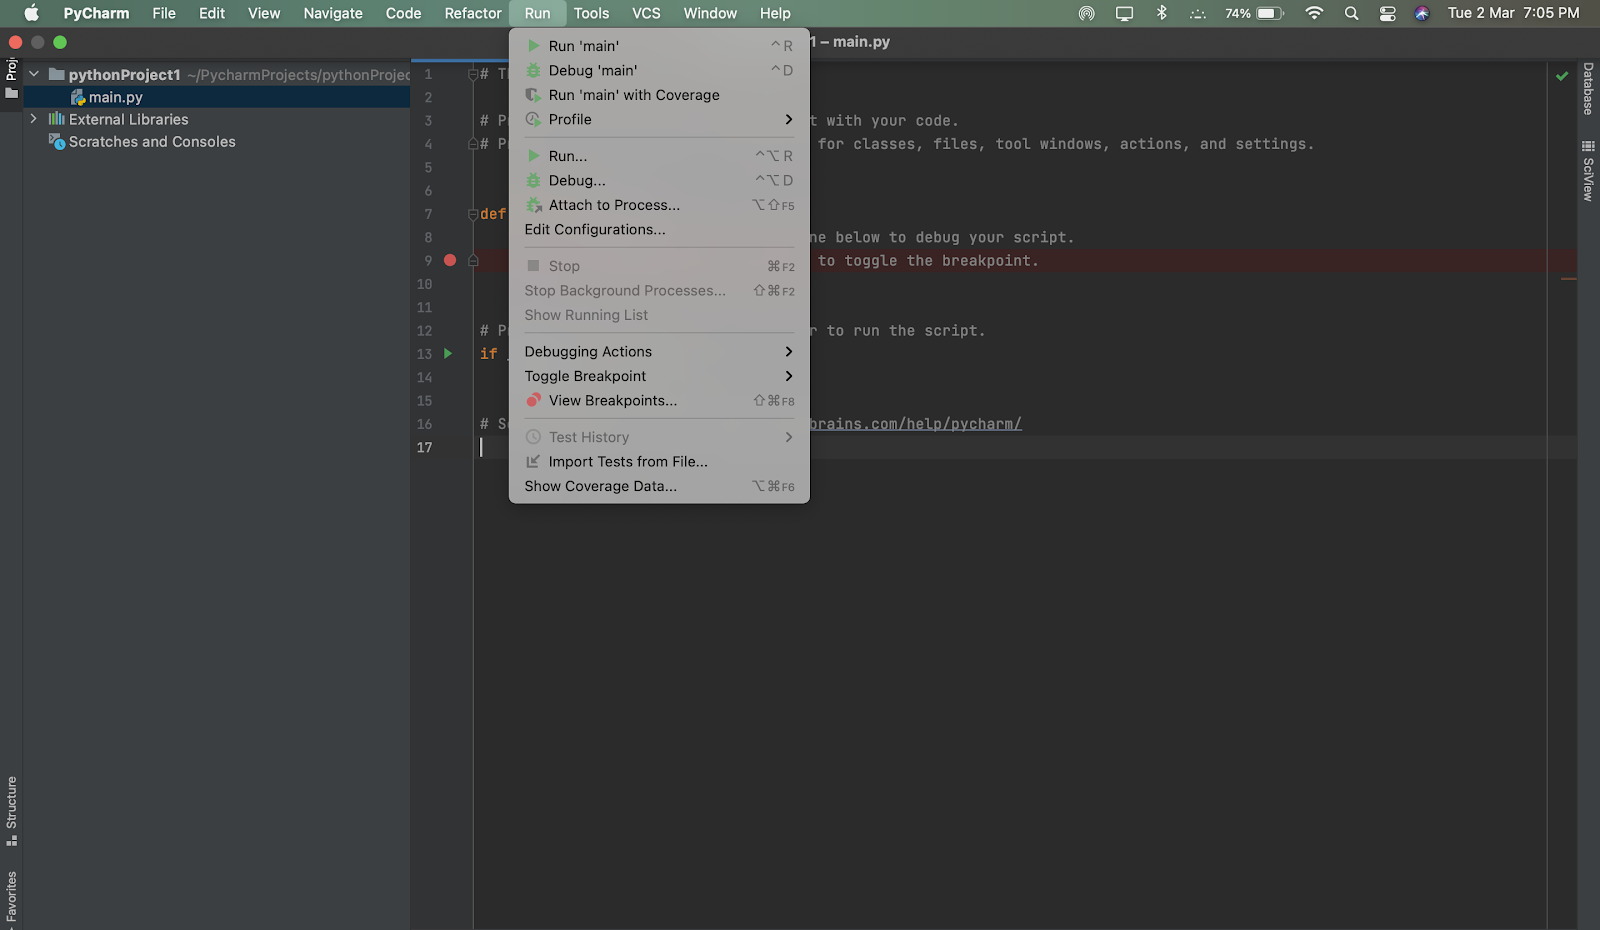
Let’s now look at how to run this default Python file that PyCharm created. You can run the file by clicking Run on PyCharm’s menu bar and selecting Run ‘Main’.
You will see the result on the console after doing that.
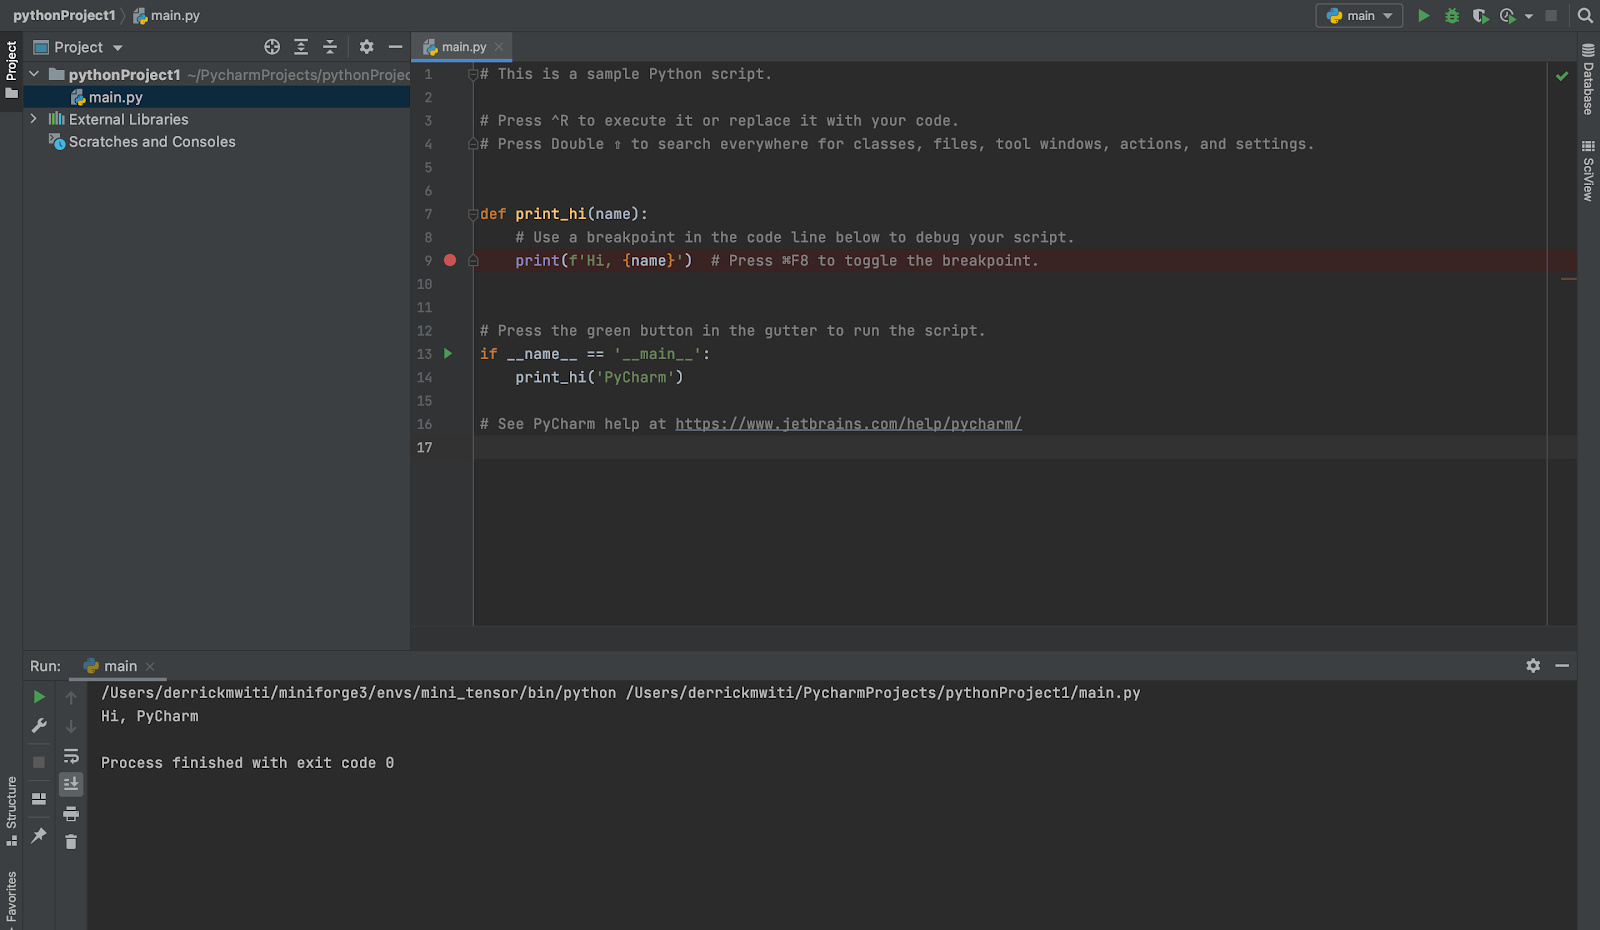
You can also run the code by clicking the green Run button on the console. For example, change the argument of the function from PyCharm to cnvrg and try it out.

Rerun the script by clicking on that green button.
Installing other packages to the virtual environment
Pycharm will usually create a new virtual environment or prompt you to select an existing one when starting a new project. Let’s now take a look at how you can install Python packages to this environment.
You can access the virtual environment by clicking PyCharm on the menu bar and selecting Preferences.

Clicking on Project will give you the option to view the Project structure or the Python Interpreter.

Clicking on the Python Interpreter will:
- show the path to the current Python interpreter
- give you the option to add a new interpreter
- show the existing packages in your environment
- allow you to install new packages to the environment
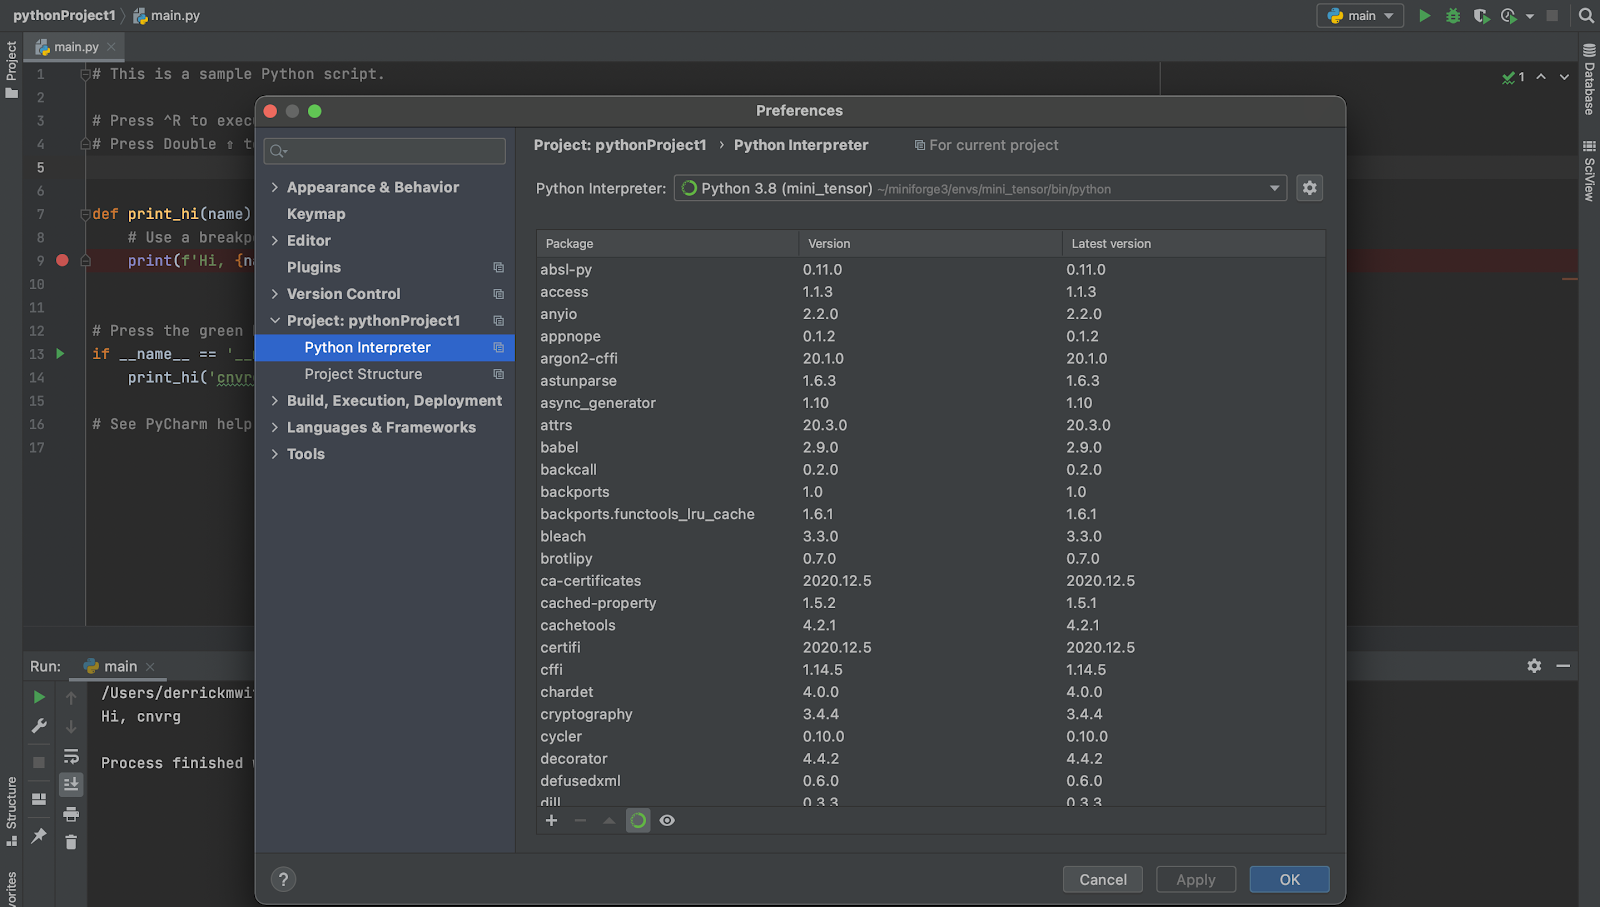
Clicking on the + button below that window will give you the option to download and install new packages.

On the next screen, you will have the option to select a package and install it. Notice that you can also choose the version of the package that you would like to install.

Uninstalling a package is done by selecting it and clicking on the minus button.

From the above screenshot, you can see that you also have the option to:
- manage your plugins
- manage the appearance and behavior of PyCharm
You have also seen how to do the two things mentioned above immediately after installing PyCharm.
Navigating in PyCharm
Let’s now take a moment to explore how you can navigate through the PyCharm interface. You have already seen that you can access the preferences by clicking PyCharm, i.e., the first item on the menu bar. Now let’s explore the others.

File
Some of the things you can do under the file menu include:
- creating a new project
- creating a new Python file
- managing the IDE settings
- saving all the files in your current project
- renaming a project
- printing a file
- exporting files to HTML

Edit
The edit menu allows you to make changes to the current file. For instance, you can:
- undo changes
- redo changes
- copy something
- look for something using the Find submenu
- select everything using the Select All submenu
- join and duplicate lines

An important thing to note is that some of the commands have keyboard shortcuts. Therefore, you can just master the keyboard shortcuts for the commands that you need to use frequently.
View
You can use the View menu to switch between different views.

For instance, you can use the Tool Windows submenu to access the following views:
- project
- favorites
- scientific view
- database
- event log

You can use the Appearance submenu to switch to:
- presentation mode
- full-screen mode
- distraction-free mode
You can also use it to toggle various bars, such as the Navigation Bar and the Toolbar.

Navigate
The Navigate menu can be used for; among other things:
- searching everywhere
- searching for a particular class or symbol
- moving from one highlighted error to the next
- navigating in the file
- checking the file structure
- managing bookmarks

Code
Use the Code menu to make changes to existing code or add new code. For example, you can:
- use the Generate submenu to generate new test cases
- dictate how code completion should happen via the Code Completion submenu
- use the Surround With submenu to surround existing code with:
– a while statement
– a try-catch statement
– an if statement
The surround with command expects you to have highlighted some code in the file.
- use the Folding submenu to expand and collapse code. Folding is useful, especially when your file starts becoming long
- reformat your code
- auto-indent the code
- locate duplicates

Refactor
The Refactor menu does precisely that; refactoring code. For instance, as you see in the screenshot below, you can:
- move the highlighted code to a file
- copy the file
- introduce a new constant, field, or variable
- extract a method
Refactoring will save you time that you could have spent refactoring your code manually.

Run
You have already seen that you can use the Run submenu under the Run menu to execute code. The Run menu can also be used to debug code. For example, you can remove a quote from the code and run Debug to see the result.

Tools
The tools menu will allow you to do a bunch of things, including:
- configuring servers
- saving a file as a template
- deploy your application
- start an SSH session
- push your application to Google App Engine

VCS
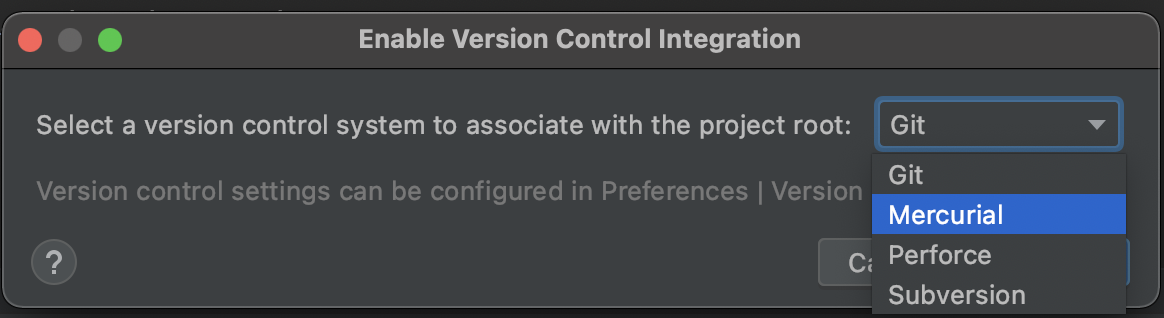
Earlier, you saw that you could create a project from a version control system. You can also manage that under the VCS menu. For instance, you can click on the Enable Version Control Configuration to enable version control.

PyCharm supports the following version control systems
- Git
- Mercurial
- Perforce
- Subversion
Once the version control system is enabled, you can perform some version control operations such as:
- creating a repo with the chosen version control system
- obtaining code for the version control system
- browsing the version control system

Window
The Window menu can be used to:
- zoom or minimize the window
- store the current layout as the default
- restore the default layout
- dictate how notifications and background tasks should be handled

Help
You can use the Help menu to get assistance whenever you get stuck.

For instance, clicking the Keymap Reference will show you all the keyboard shortcuts you can use in PyCharm. You can change any shortcuts that may conflict with your computer’s built-in shortcuts. You are not expected to master all these shortcuts. However, as you keep working with PyCharm, some of them will be at your fingertips.

Searching in PyCharm
You have already seen that you can search for items in PyCharm using the Navigate menu. Search can also be accessed by clicking the search icon at the far top right of PyCharm as shown in the screenshot below. You can also access the menu using the shortcut shown in the Keymap Reference above.

For example, you can search for plugins, click on the first result and you will be taken to the plugins management window.

Note it also allows you to search everything, classes, files, symbols, and actions.
Editing an existing project in PyCharm
In PyCharm, you can create a new project under the File menu.

Recent projects can be accessed under the Open Recent submenu. After that, the project will open, and you can continue editing it normally.

Code completion in PyCharm
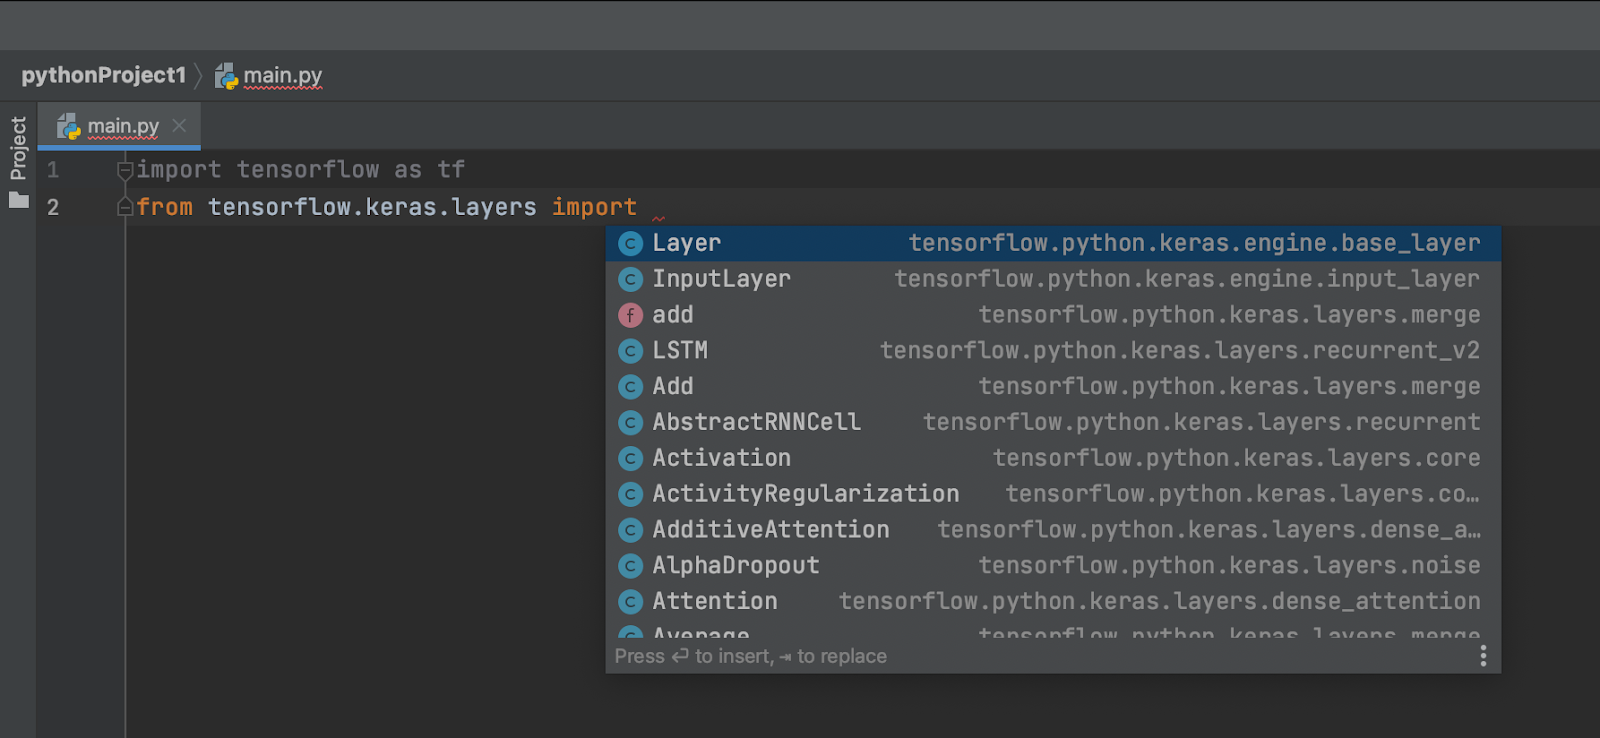
Now get rid of the dummy code that PyCharm created when you started the project. Next, let’s illustrate how you can take advantage of PyCharm’s code completion. For example, you can see that after typing “laye” PyCharm suggests layers to us. You can apply that suggestion by pressing Enter on Windows or Linux or Return on Mac.

Now, suppose that you wanted to import specific modules, but you weren’t sure of their names. After typing the word import, you can press Control + Space (Command + Space on Mac) to get suggestions. You can then use the up and down arrow keys to scroll up and down. Press on Return or Enter when you find the module that you are looking for.
Debugging your code in PyCharm
One of the other powerful features in PyCharm is code debugging. Let’s look at how you can use that feature to debug your code. You can start debugging your code by clicking Debug from the Run menu.

You can also access the functionality by clicking the Debug icon on the toolbar. It is the icon next to the play icon.
One of the ways to debug your code is to start by setting breakpoints. Breakpoints suspend the execution of code at a certain point. You can set a breakpoint by clicking next to line the numbers from the gutter.

After that, you can click on the debug icon to start debugging the code
Stepping into the code
The code execution will stop at the breakpoint when you run the program in debug mode. However, you can step into the code and see the values of the variables at each point. This is better than writing print statements at every point.
Let’s use operations on TensorFlow tensors to illustrate how this can be done. You can see that PyCharm highlights every line as it gets executed.

As you can see above, running the code in debug mode opens the debug toolbar. You can use this to control various aspects of the debugging process, for example stepping into the code. From the GIF above, you can see that stepping into the code also steps into the library code when a particular function from TensorFlow is called. While this can be useful at times, you can also see that it can also take a lot of time to step through library code. On most occasions, you just want to step into your code.
Step into my code
Let’s repeat the same process but now just stepping into our code. Hovering on the icons with the blue color will show you which one is the step into my code button.

Start the entire process again but use the Step into my code button instead of the Step into button. You can now see that the debugging process doesn’t step into the TensorFlow code.
You can also see the value of the variables at each step.
Finding the bug
Let’s now introduce some errors into the code and step into it again. This can be illustrated by changing one item’s value in the tensor to be a string and changing one tensor’s shape from the multiplication example. You can run debug on the entire program without creating any breakpoints. This will run and show you the error in the console.

Let’s now step into the code by adding a breakpoint. By doing this, you will see the line that generates the error. As you can see below, the first error occurs after running the adding operation. That can indicate that the variables being added are not in the required format. After the error has occurred, you can click on the console to see the exact error.

Solve that error, and let’s move on to addressing the next one. You can now create the breakpoint in the next function since you know that the error occurs in that function. The error occurs after line 17 is executed. You can check the console for the exact error message. In this case, the error is that the input tensor is not in the expected shape.

Note: You might get a prompt to install the Cython extension when debugging in PyCharm. You don’t have to install it. However, installing the extension will speed up your debugging process because the Cython plugin is faster. This can save you lots of time, especially if you have a large codebase.
Testing your code in PyCharm
You can also create and run unit tests within PyCharm. It uses Python’s Unit testing framework by default. However, you can change this from the Preferences menu. Click on the menu, then select Tools→ Python Integrated Tools→ Testing. Other frameworks that are supported include:

You can create tests by clicking the Code menu then selecting Generate. After that, PyCharm will create a test file for you. You can add your test cases to that file.

When your test classes are ready, you can run them by clicking the green run button from the gutter. You will get an OK message from the console when all the tests run without any errors.

Let’s introduce an error to the second test class so that you can see how a failed test would look like.
The test shows that one test passed while another failed. It also displays the reason the test failed.

Using version control in PyCharm
Let’s assume that you are working on this project and want to keep pushing the code to Github. The first step will be to hop over to Github.com and create a new repository.

Copy the repo’s URL and head back to PyCharm.
Start by creating a new Git repository.

After that, the Git menu will appear on PyCharm’s menu bar.

Click on Manage Remotes so that you can link the remote repository.
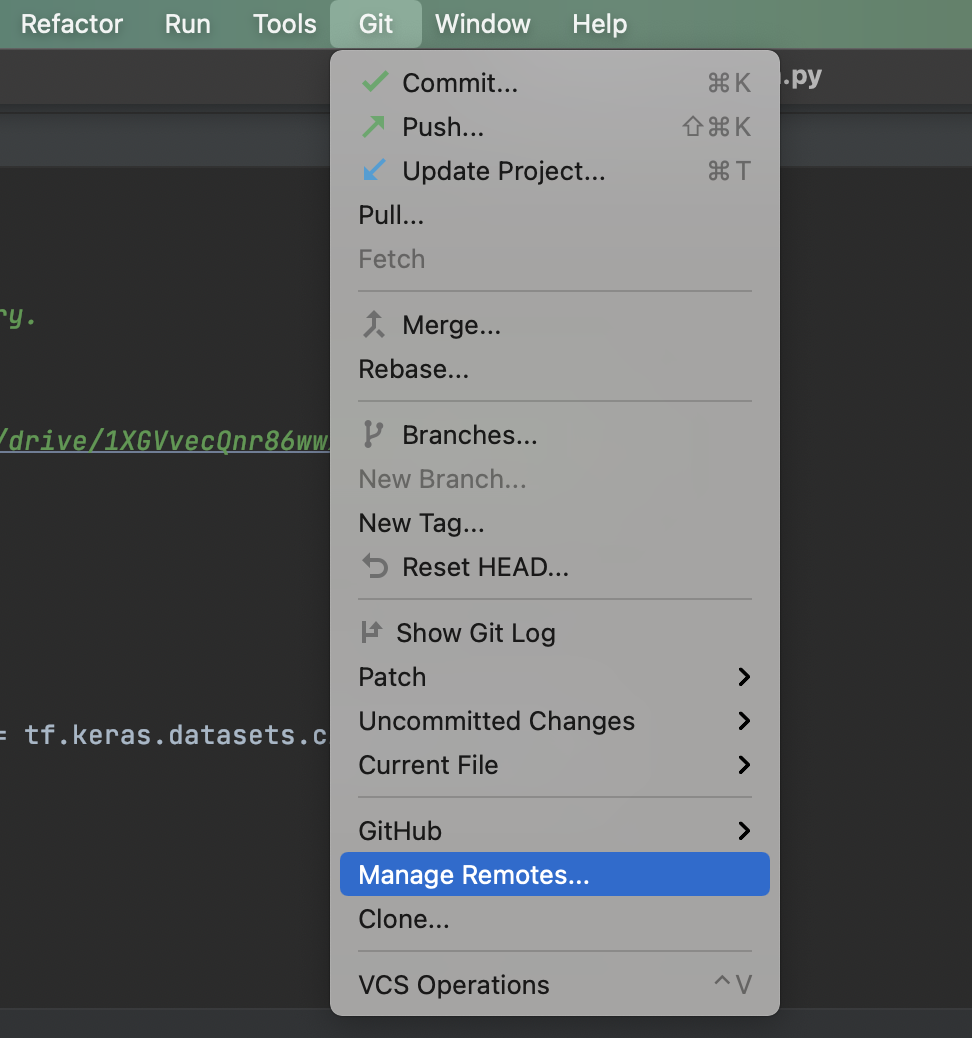
Click the + icon on the next window to add the remote URL.

In the next window, you will get the opportunity to add the URL.

After clicking okay, you will notice that the Git Remotes have been updated. Press Ok to proceed.

You can now press Commit on the Git menu to commit your current code.
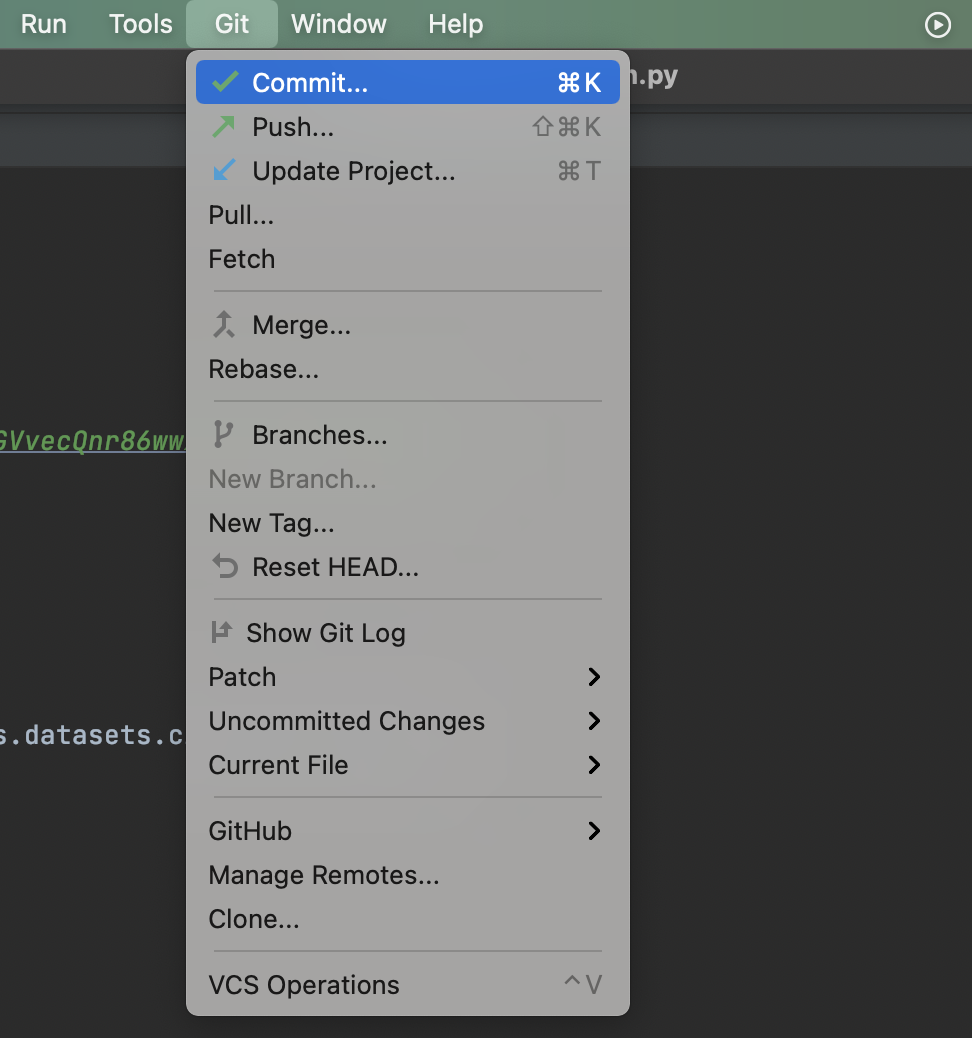
This will then give you the option to write a commit message.

You can now click on the Commit button to commit your code. Alternatively, you can press the Commit and Push button, and your code will be committed and pushed to the remote repo. If this is the first time you are using Git on that machine, you will get a prompt to set the global name and email.
You will then get a prompt to sign in to your Github account once you click on the Push button. If you have configured Git to use an SSH key, you won’t get this prompt. Setting up SSH keys is important because it will save you time since you don’t have to log in to your account every time you want to push code.

You can now see that the code has been pushed to the remote URL.
PyCharm database tools
The Database Tools and SQL plugin enables the management of databases in PyCharm. The plugin is installed by default. It allows you to create databases and query them. Some of the databases that are supported include:
- MySQL
- Oracle
- SQLite
- PostgreSQL
- Microsoft SQL Server
- MariaDB
- Apache Cassandra
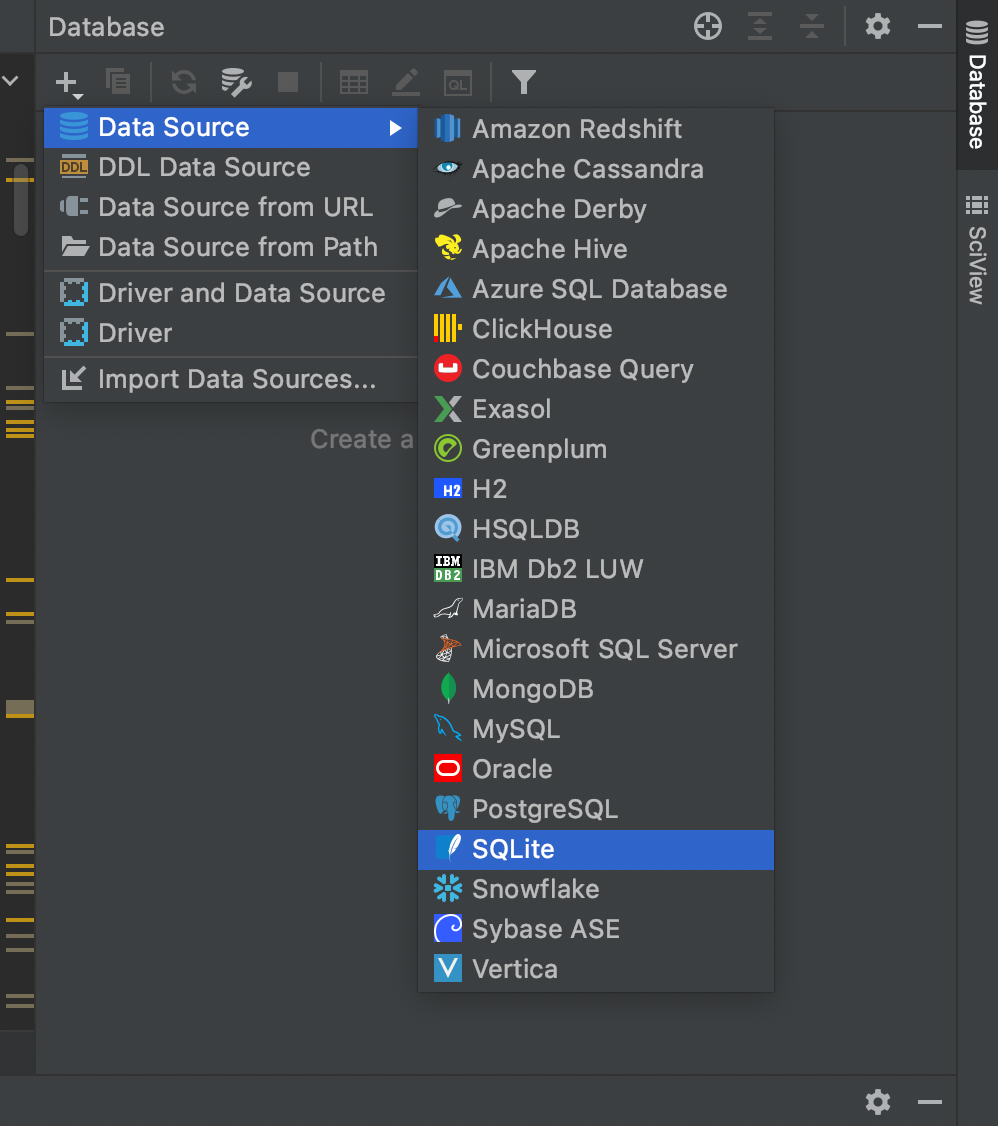
Let’s take a look at how you can set up an SQLite database. The database view can be activated from the View menu. To activate it click Database from the Tool Windows submenu.

Use the + icon to create a new SQLite database.
The next window will give you the option to name the database. Also, click on Download to download the missing drivers. PyCharm doesn’t ship with these drivers to reduce the size of the installation package.

Ensure that you also click on Test Connection to confirm that the connection was successful.

If you already have an SQLite DB file, you can drag it to the database window and click Test Connection to ensure that the connection was successful.
After successfully connecting, a new console window will be created. You can use this to run SQLite commands. For example, let’s write a query that will create a new user table.
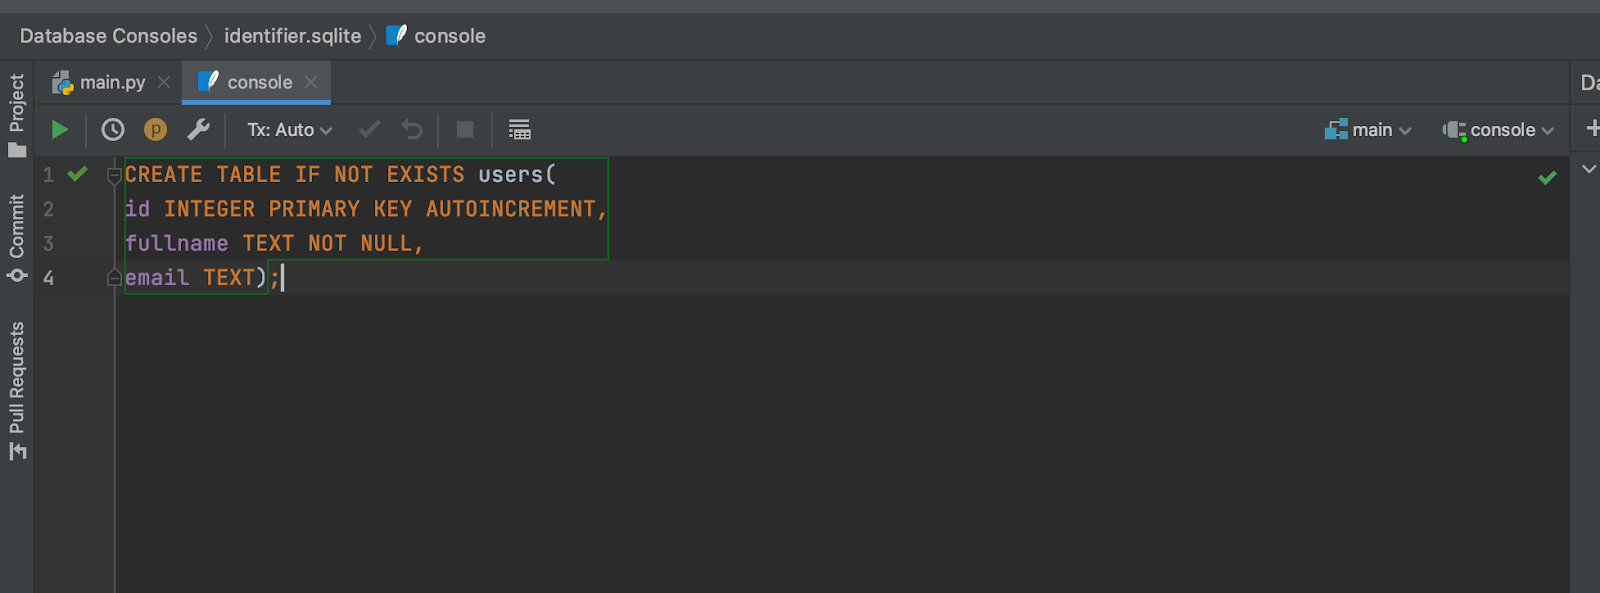
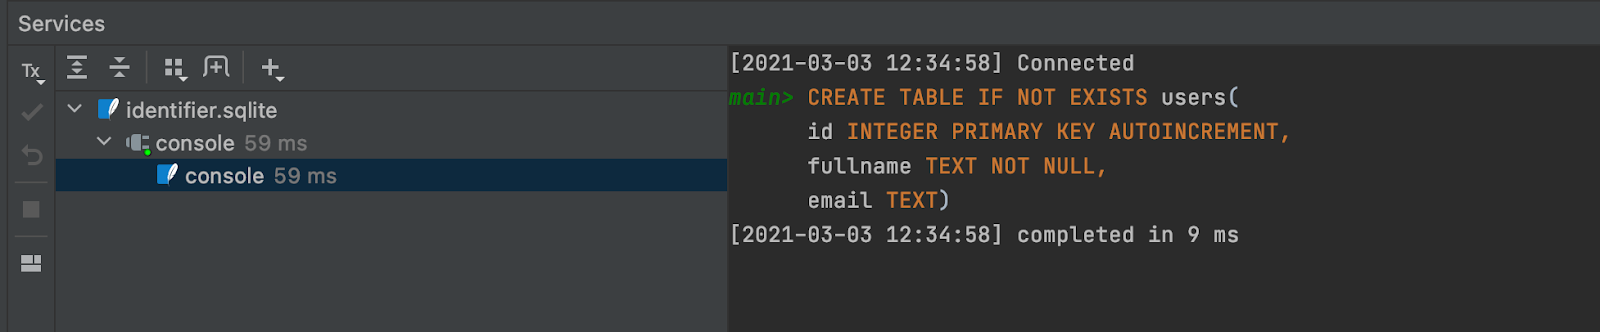
Click the green button to the left to execute the query. The result will be displayed on the console.
Let’s now take a look at how you can add data to that table. You can write an SQL insert statement to do that.

The console will display the number of rows that were affected, meaning that the query ran successfully. Ok, let’s now look at how you can query this table. Write the select query and run it using the green button.

The results will be displayed on the console. Let’s take a look at that.

How to export data
When you look at the far right of the above screenshot, you can see a download icon; you can click that icon to export the data. That will display a window that will enable you to set the needed export options.

As you can see below, the data can be exported in one of the following formats:
- CSV
- Excel
- HTML
- JSON
Just to mention a few.

PyCharm scientific mode
PyCharm allows you to work on data science projects by creating a scientific project. The process is the same as you have done previously. The only difference is that you are not creating a pure Python project but a scientific one. You also get the option to use an existing Python environment or create a new one.

Let’s now use this GitHub Gist for this illustration. You can use `#%%` when writing code in scientific mode to arrange your code into cells. Check the screenshot below for an example.

Some of the things that you can do while in the scientific mode include:
- displaying Matplotlib plots
- viewing NumPy arrays and Pandas data frames
- create a Jupyter notebook
The data and plots can be viewed by enabling SciView. You can enable it from the View menu by selecting SciView under the Tool Windows submenu.

After that, you can use the view to visualize data and plots as shown below:

PyCharm will also keep track of the last plots that you had created. This is useful, especially when you want to compare them.
Interactive Python console
Sometimes you might want to run one or just a couple of runs of code. It, therefore, doesn’t make any sense to rerun the entire Python script. You don’t want to keep repeating time-intensive tasks such as model training. Let’s say that you have trained your model and just want to see its summary. You can use the interactive Python console on PyCharm to run a single line of code. You can do that by highlighting the line(s) that you want to execute, right-click and Execute Selection in Python Console in Console.

If you have used `#%%` to create cells, you can right-click on the cell to run it. That is done by selecting Execute cell in console.

You can also write code directly to the console.

The console also offers code autocompletion capabilities.

Analyzing data
PyCharm also allows you to analyze and export data. For instance, you can filter the data based on a certain column or expression.
Documentation tool window
PyCharm enables easy access to function documentation via the documentation window. Whenever you click on a function, its documentation is shown on the documentation window.

Jupyter Notebook Integration
With scientific mode enabled, you can also create a Jupyter Notebook. This can be done from the File menu.

After that, you can continue using the notebook just like you are already used to.
PyCharm macros
PyCharm macros can be used to automate repetitive tasks. When faced with a repetitive task, you can record a macro for that and bind it to a keyboard shortcut. For instance, the process of creating new cells seems like a repetitive task. Let’s create a macro for that and bind it to a keyboard shortcut.
The functionality to record macros can be found under the Edit menu. To start recording, select Start Macro Recording from the Macros submenu.

Click start recording and create a macro for `#%%`. After typing it, head back to the Edit menu and stop recording or hit the floating red button. If you intend to keep using this macro, you will need to give it a name. Otherwise, it will be saved as a temporary macro.

The next step is to bind this macro to a keyboard shortcut so that you can access it easily. For example, let’s bind it to the Shift + Command + w . on Mac or Shift + Control + w on Linux and Windows. Keymap functionality can be accessed from the Preferences menu.

Let’s now bind that macro to a keyboard shortcut. After that, you can use the shortcut to create new cells in PyCharm.
You can play macros from the menu if you don’t want to create shortcuts. If you didn’t name the macro, you can play it by clicking Play Back Last Macro.

Moving forward, you will use that shortcut to create a new cell.
PyCharm Tips
You can learn how to be more productive with PyCharm by accessing the Help menu’s Productivity Guide.


Let’s take a look at some shortcuts that you use to make your development process faster. These are some of the shortcuts in quickfire:
Formatting code
You can format your code using Command + Option + L command on Mac or Control + Alt + L on Linux and Windows.

Viewing a method’s signature
A method’s signature can be viewed using Command + P on Mac and the Control + P on Windows and Linux.

f string completion
When you start typing ${my_variable.. within a string, PyCharm will do the f string autocompletion for you.

Code refactoring
You can refactor your code in PyCharm by selecting some piece of code and clicking Refactor.
Renaming variables
When you rename a variable, an icon will appear in the gutter that gives you the option to rename all the variable occurrences. For instance, let’s rename the model and see how all references to it can be renamed.
Extracting variables
The Command + Option + V shortcut can be used to extract variables on Mac. On Linux and Windows, that will be Control + Alt + V. For example, let’s extract a variable from all occurrences of `tf.keras.layers`.

Extracting methods
The Command + Option + m shortcut can be used to extract methods on Mac. On Linux and Windows, that will be Control + Alt + m.

Duplicating lines
Use Command + D to duplicate lines. On Windows and Linux, that’s Control + D.
Multiple selections
You can use Command + Control + G to select all occurrences of a variable of code and replace all of them. Let’s say, for some reason, you want to import TensorFlow as tfa and not tf. You can change all the occurrences of tf to tfa using a keyboard shortcut.

An alternative is to use Alt (Option on Mac) while clicking on all the instances of the item you would like to replace.

Collapsing and uncollapsing
Use Command + – to collapse code and Command + = to uncollapse it. On Windows and Linux, replace Command with Control.

Surround and unwrap
To surround code use Command + Option + T.

Track changes in a file
Tracking changes in a file can be done using Alt + Shift + C on Windows and Linux. If you are on Mac, that’s Option + Shift + C.

To learn more, check out the shortcuts documentation on PyCharm’s website.
Using PyCharm with cnvrg
cnvrg offers multiple ways to leverage the platform through PyCharm IDE. From PyCharm you can choose to leverage the SDK and cli tools to execute experiments and access deployments and datasets as well as all other cnvrg features. You may also connect PyCharm via ssh to use a cnvrg workspace and all of its resources as the execution backend to your PyCharm IDE. This allows you to write and test code locally with the option to execute on far more resources and larger datasets when you are ready for serious testing of your ML and AI flows. Below are two links to help you get started with leveraging cnvrg to make PyCharm more performant and gain access to the vast resources available through cnvrg without leaving your IDE.
Use Remote Python Interpreter in PyCharm with cnvrg
Final thoughts
In this article, we have covered many topics that can help you improve your development using PyCharm. Specifically, you have covered:
- how to use the PyCharm’s interface
- creating virtual environments in PyCharm
- starting a scientific project
- using version control in PyCharm
- debugging and testing your code
- creating macros and attaching them to keyboard shortcuts
- working with databases in PyCharm
- customizing PyCharm’s theme and color
…and so much more.
Now go forth and explore PyCharm!