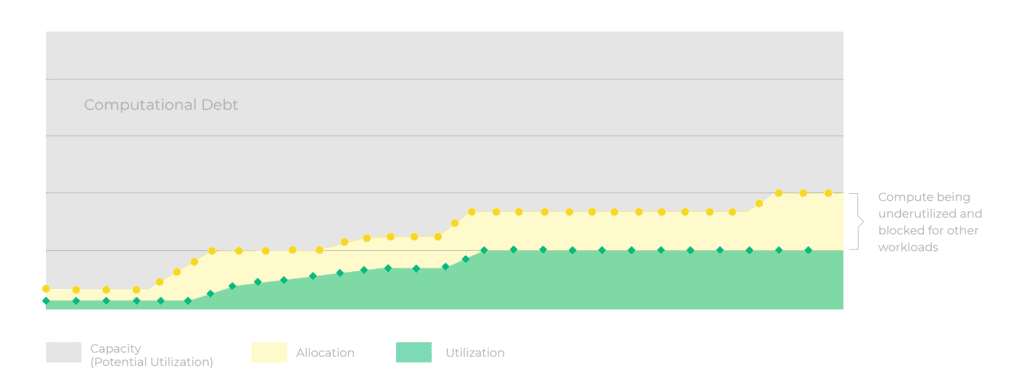
One of the leading factors impeding the ROI for machine learning is the under-utilization of GPUs, CPUs and Memory resources. Companies invest millions of dollars on compute that has the potential to dramatically accelerate AI workloads and improve performance, but end up only utilizing a small fraction of it, sometimes as low as 20% of these powerful resources. The gap between compute allocation and actual utilization is shocking, and can cost companies more than they realize. At cnvrg.io, we like to call this gap, “computational debt”.
On average, organizations only utilize 20% of total resources
Machine learning and deep learning are compute intensive and complex to manage, making this computational debt difficult to reduce. Many infrastructure teams lack visibility to ML Servers and memory utilization, and are rarely able to correlate a job to its utilization metrics. Not only that, but a lack of visibility can disrupt productivity, by blocking underutilized GPUs from being used for another job. This results in more time wasted waiting for the GPU availability, and wasted resources on top of that. One of the greatest challenges for AI infrastructure teams is understanding how to increase utilization, and manage the resources in a way that maximizes consumption, and increases the ROI of machine learning projects.
cnvrg.io increases utilization by providing an advanced resource management solution with our meta scheduling tools, and straightforward attachment of compute resources to jobs. Now, we are excited to also deliver 100% visibility and data into our resource management and AI infrastructure solution.
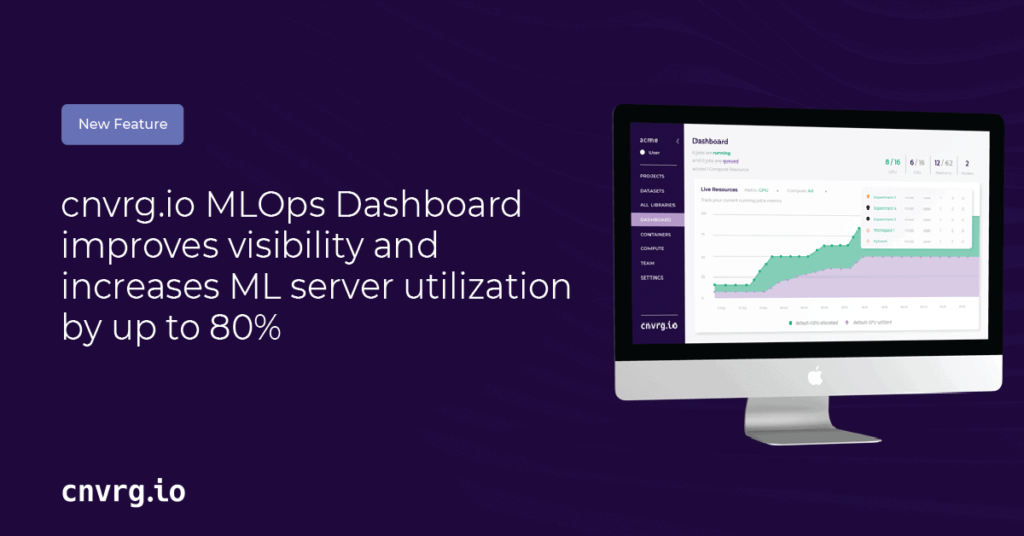
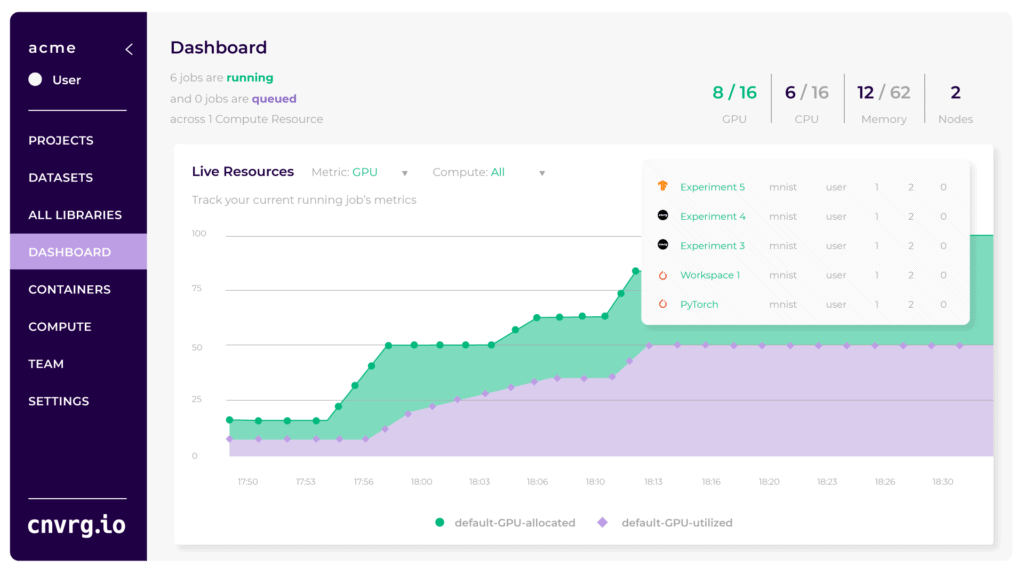
Introducing the MLOps Dashboard
When it comes to resource management, there are few solutions that maximize visibility of GPU/CPU and memory consumption for infrastructure teams to improve utilization. cnvrg.io has introduced the MLOps Dashboard to help infrastructure teams visualize allocation and utilization of different jobs, clusters, by user and by job. With MLOps Dashboards, IT teams can visualize live metrics like GPU, CPU and Memory utilization to identify workload bottlenecks and avoid wasting expensive resources. Teams using MLOps Dashboards can go from 20% to 70% utilization by re-allocating resources to more computationally heavy jobs, and by reducing compute for historically underutilized jobs. MLOps Dashboards help infrastructure teams to:
- Visualize GPU/CPU utilization across runs
- Compare real time allocation vs. utilization at any timestamp
- Show active jobs with info about user, project, container, allocation, utilization
- Connect consumption metrics with any external data analytics platforms like Tableau, Data Studio, excel and more
- Set up chargeback for IT to control project and user budgets
Monitoring capacity vs. allocation vs. utilization
The dashboard delivers a snapshot of everything executed across compute clusters in terms of usage and user activity. Admins can monitor and compare overall capacity vs. allocation vs. utilization with straight forward graphs to identify gaps in efficiency. They can simply hover over specific timestamps to investigate jobs active at that time and info about user, project, container, allocation, utilization.
As historical utilization is being aggregated and stored, cost data can be calculated across different metrics (user, project, job, cluster) and help to report usage. This feature also offers a way to search through different jobs and monitor projects and users in one place. IT can analyze and re-evaluate compute templates and restructure for optimized utilization.
Benefits of using MLOps Dashboards
- Gain higher utilization of GPUs/CPUs and Memory resources
- Forecast future GPU/CPU consumption needs
- Reduce “computational debt” with better compute budgeting
- Give IT, DevOps and team leaders full control of project budget
- Visualize all GPU/CPU and Memory allocation and utilization data in one place
Data-Driven ML Infrastructure Planning
Now organizations can improve ROI of their machine learning with insightful analytics into their GPU/CPU and Memory consumption. Consumption data is collected across all ML workloads, correlated to the ML infrastructure and providing a 360 view on all ML workflows. Infrastructure teams can extract insights and make informed decisions like how many GPUs to buy in the future, deliver data driven capacity planning, or identify what kind of workloads are the most compute intensive. They can identify large gaps between allocation and utilization and provide recommendations to the data science team, and build a new structure for resource allocation.
We’re excited to begin solving this massive gap in the industry, and help organizations reduce “compute debt” with regularly updated features for infrastructure teams.
MLOps Dashboards are now available across all cnvrg.io Premium and CORE users. To learn more about how your team can reach 80% utilization across ML workloads you can you can schedule a demo.