
Table of Contents
Introduction to Anomaly Detection in Python
It is always great when a Data Scientist finds a nice dataset that can be used as a training set “as is”. Unfortunately, in the real world, the data is usually raw, so you need to analyze and investigate it before you start training on it. The process of preparing a dataset for training is called Exploratory data analysis (EDA).
There are many steps you can take when exploring the data. For example, you might want to check the distribution of the features in the dataset, handle the NaNs, find out if your dataset is balanced or not, and many more. Still, some steps must be taken regardless of the task you need to solve. If you skip them, it might significantly affect your model. One of these steps is Anomaly Detection.
In this article we will talk about:
- What is an Outlier?
- Outlier vs. Anomaly
- Types of Outliers
- Why do you need to detect Outliers?
- Brief overview of Anomaly Detection Algorithms
- Key steps in Anomaly Detection
- PyOD
- What is PyOD?
- Features of PyOD
- Outlier Detection algorithms in PyOD
- Extra Utilities provided by PyOD
- How to install PyOD?
- Working with PyOD in Python
- Why should you try PyOD for Outlier Detection?
- Interquartile range
- Box-plots
- Automatic Outlier Detection Algorithms
- DBSCAN
- Elliptic Envelope and Minimum Covariance Determinant
- Isolation Forest
- Local Outlier Factor
- One-Class Support Vector Machine
- Unsupervised Outlier Detection
- Clustering based approach
- Outlier Detection as a Classification problem
- Outlier Detection in Time Series
- How to handle Outliers?
- How to get started with studying Anomaly Detection?
Let’s jump in.
What is an Outlier?
Outlier is an intuitive term. In our everyday life, an outlier is something that differs a lot from similar objects. For example, Formula 1 cars are outliers as they can drive way faster than the majority of cars. So, in more formal words, an Outlier is an object that deviates significantly from the rest of the objects.
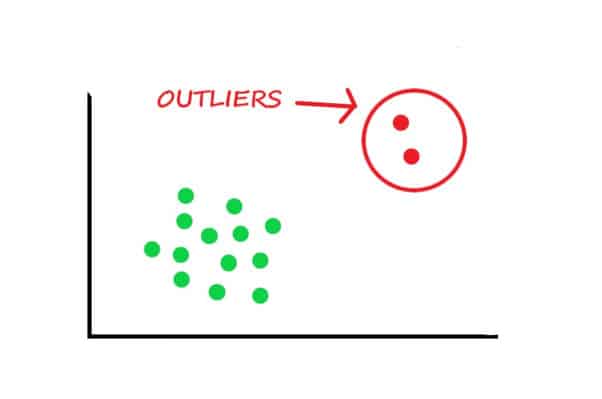
Image source: Data Science Foundation
The picture above features a simple example that might occur when exploring the data. As you might notice, green dots are nicely grouped while red dots lay too far from the green ones. Such a graph must alert you as the red dots can be the outliers.
Outlier vs. Anomaly
Right now you might be wondering why the article is dedicated to Anomaly Detection, but you are reading about the Outliers. Let’s make this clear. In general, you can differentiate between these two terms. However, in Data Science Anomaly and Outlier terms are interchangeable. Anomaly detection itself is a technique that is used to identify unusual patterns (outliers) in the data that do not match the expected behavior. Moreover, sometimes you might find articles on Outlier detection featuring all the Anomaly detection techniques. Thus, over the course of this article, I will use Anomaly and Outlier terms as synonyms.
Types of Outliers
There are various classifications establishing outlier types. However, all of them feature the same ideas:
- Point or global Outliers are objects that lay far away from the mean or median of a distribution. For example, a very rich man that spends loads of money daily can be considered an outlier for a bank that holds his bank account.
- Contextual or Conditional Outliers are the usual thing for time-series problems. Just as the name states, these Outliers are context-specific. For example, spending a lot of money during the Christmas holiday is a common thing, but if you spend a comparable amount of money at other times of the year, it might be an Outlier.
- Collective Outlier is the Outlier objects that are closely grouped because they possess the same Outlier nature (they are considered Outliers due to similar reasons). For example, a cyber-attack on your server will be an Outlier as your server does not get attacked daily. A set of cyber-attacks will be the Collective Outlier as it has the same origin.
Why do you need to detect Outliers?
As mentioned above Outlier Detection is a crucial part of EDA which in turn is a key to the successful Machine Learning (ML) project. ML algorithms are quite sensitive to the features’ distribution and range. Therefore every Data Scientist analyzes the data and gets rid of the outliers that affect the distribution. Nevertheless, exploring the data and the field of study before detecting the outliers is a must-have step because it is important to define what should be considered an outlier.
There are many advantages in performing the Outlier Detection, for example:
- You will be able to get a “clean” dataset with no outliers
- Having a “clean” dataset results in a faster training process
- Your model will be more accurate
- Your results will not be spoiled by outliers
Brief overview of Outlier Detection techniques
There are a lot of Outlier Detection approaches and various classifications of these approaches. Moreover, sometimes algorithms combine various techniques, for example, DBSCAN is both the density- and clustering-based algorithm. Still, each of these algorithms has a technique that is the main basis. That is why today we will cover:
- Distribution-based techniques – Minimum Covariance Determinant, Elliptic Envelope
- Depth-based technique – Isolation Forest
- Clustering-based technique – Local Outlier Factor
- Density-based technique – DBSCAN
- Unified library for Outlier Detection – PyOD
- Statistical techniques – Interquartile range
- Visualization techniques – Box-plot
For the next sections, I have prepared a Google Collab notebook for you featuring working with every Outlier Detection algorithm and library covered below in Python. Please feel free to experiment and play around as there is no better way to master something than practice.
Key steps in Outlier Detection
- Explore the data and the field of study to identify what should be considered an outlier and what should not
- Visualize the data if possible and analyze it searching for anomalies
- Identify the type of outliers in the data (there might be more than one type)
- Pick an Outlier Detection algorithm based on personal preferences and the information you possess (for example, the distribution of the data, types of outliers)
- Adjust and tune the algorithm to your data if needed
- Detect and visualize the outliers
- Remove the outliers
PyOD
What is PyOD?
Python Outlier Detection or PyOD is a comprehensive and scalable Python library for detecting outlying objects. As of today PyOD has more than 30 Outlier Detection algorithms implemented. The library provides a complete and easy to navigate documentation full of valuable examples. Moreover, PyOD is regularly updated and is well recognized among the Data Science community.
Features of PyOD
There are several key features of the library that are mentioned in the PyOD official documentation:
- The unified API is the greatest strength of PyOD. It makes the library a universal toolkit that is easy to use
- PyOD provides well-written documentation that has simple examples and tutorials across various algorithms
- Variety of the Outlier Detection algorithms starting from the classical ones from scikit-learn to the latest deep learning approaches
- The library is optimized and parallelized. Thus, it works quite fast
- PyOD works both with Python 2 and 3
Outlier Detection algorithms in PyOD
As mentioned above, PyOD provides more than 30 different Outlier Detection algorithms right now. However, this number is constantly growing. For example, in 2019 PyOD had only 20 algorithms aboard.
All the algorithms implemented in PyOD can be divided into two large groups: individual detection algorithms and Outlier ensembles & Outlier detector combination frameworks.
Individual detection algorithms just as the name suggests are the Outlier Detection algorithms that are usually used alone. Among them, you may find a lot of algorithms that will be covered later in this article, for example, Isolation Forest, Local Outlier Factor, One-Class Support Vector Machines, and others. On the other hand, Outlier ensembles & Outlier detector combination frameworks either use ensemble techniques, for example, Feature Bagging algorithm, or combine simple techniques to complete the task.
If you want to check the full list of the algorithms, please refer to the related documentation section.
Extra Utilities provided by PyOD
PyOD provides several valuable utility functions that are designed to make the exploring process easier. There are such functions as:
- generate_data() function that can be used for synthesized data generation
- generate_data_clusters() function that can be used to generate more complex data patterns with multiple clusters
- wpearsonr() function that calculates the weighted Pearson correlation of two samples
- and others
For further information including simple examples please refer to the official documentation.
How to install PyOD?
PyOD can be easily installed via pip:
pip install pyod
Still, there are other approaches, for example, cloning the library from the repository. Please refer to the official installation documentation to find out more.
It is worth mentioning that despite PyOD having multiple neural network approaches for Outlier Detection implemented you need to install Deep Learning frameworks Keras and TensorFlow on your own as PyOD will not install them for you.
Working with PyOD in Python
As mentioned above, PyOD documentation has many simple examples, so you can start using it smoothly. In the Google Collab notebook, I have implemented a simple example based on the KNN example from the PyOD’s documentation. In my example we will generate data using PyOD’s utility function generate_data(), detect the outliers using the Isolation Forest detector model, and visualize the results using the PyOD’s visualize() function.
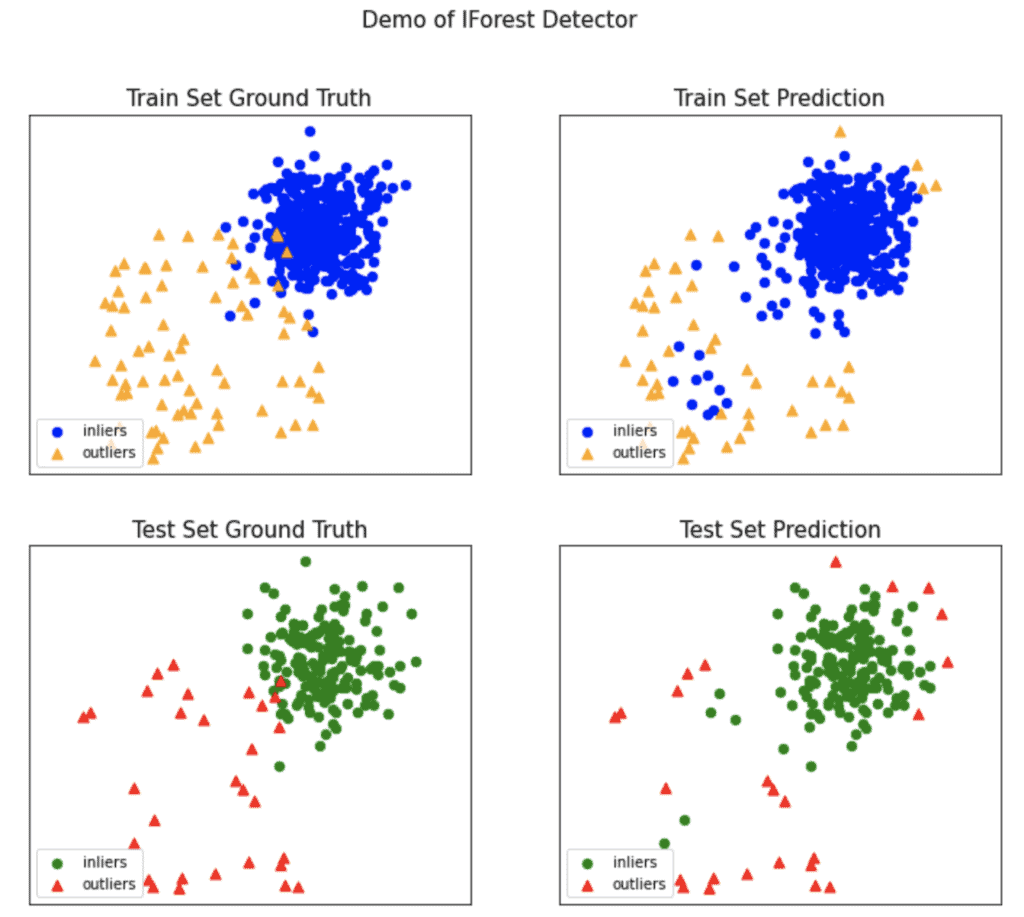
Image source: Notebook
Why should you try PyOD for Outlier Detection?
Overall, PyOD is a nice and powerful Outlier Detection tool you should definitely try because there are not many Python libraries that specialize in this task. Sure, you can use standalone Outlier Detection algorithms from various libraries, but it is always handy to have a library that has many implementations and is easy to use. Thus, I strongly advise giving PyOD a shot in your next Machine Learning project.
Interquartile range
Interquartile range is a technique based on the data quartiles that can be used for the Outlier Detection. The general algorithm is as follows:
- You need to calculate the 25th and 75th quartile of your data
- You need to calculate the Interquartile range (IQR) by subtracting the 25th quartile from the 75th one
- Then you need to calculate the upper and the lower bound (maximum and minimum values) of your data using the 25th and 75th quartiles
- To calculate the upper bound you need to multiple IQR and 1.5, and then sum the result with the 75th quartile
- To calculate the lower bound you need to multiple IQR and 1.5, and then subtract it from the 25th quartile
- The samples that are less than the lower bound or more than the upper bound are considered the outliers.
For further code please refer to the related section of the Notebook.
Box-plot
There is no doubt you have either seen, worked with, or even built box-plots while working on Machine Learning projects. Thus, you know that box-plot is a graphical representation of numerical data through their quartiles.
So, box-plot is not a unique technique, it is simply a visualization approach to the Interquartile range Outlier Detection algorithm. The dots in the upper and the lower half of the picture below are actually the outliers.
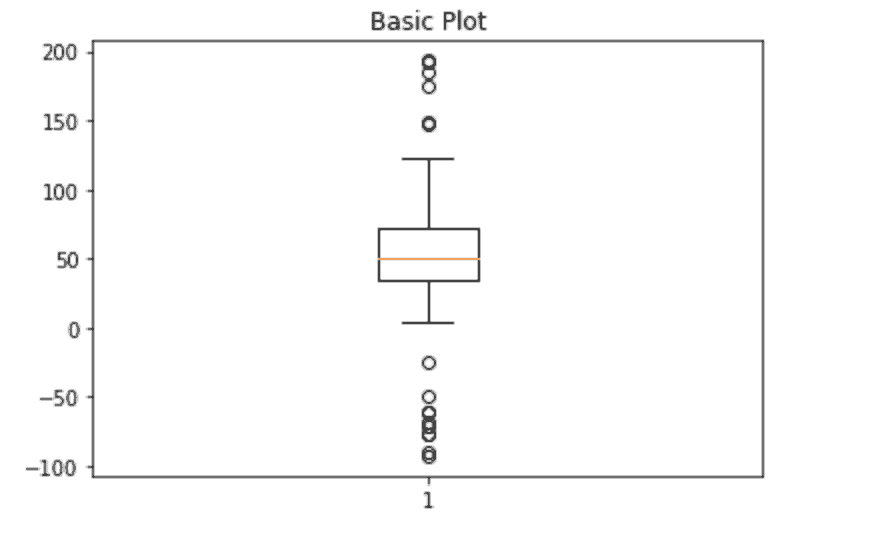
Image source: Notebook
Overall, a box-plot is a nice addition to the Interquartile range algorithm as it helps to visualize its results in a readable way. For further code please refer to the related section of the Notebook.
Automatic Outlier Detection Algorithms
As mentioned above, it is always great to have a unified tool that provides a lot of built-in automatic algorithms for your task. Now when you know what PyOD is, it is time to talk about the most popular Machine Learning library scikit-learn or sklearn.
sklearn
Sklearn has many Outlier Detection algorithms implemented. However, sklearn is not focused on the Outlier Detection task, so these algorithms are not unified and you will have to learn how to use each of them individually. Still, it is worth mentioning that some algorithms in this section, for example, Isolation Forest are present in PyOD as well. That is why you should explore the opportunities and see which library you like more.
DBSCAN
Density-based spatial clustering of applications with noise or simply DBSCAN is the Unsupervised Learning clustering algorithm that is widely used in Outlier Detection due to its general concept.
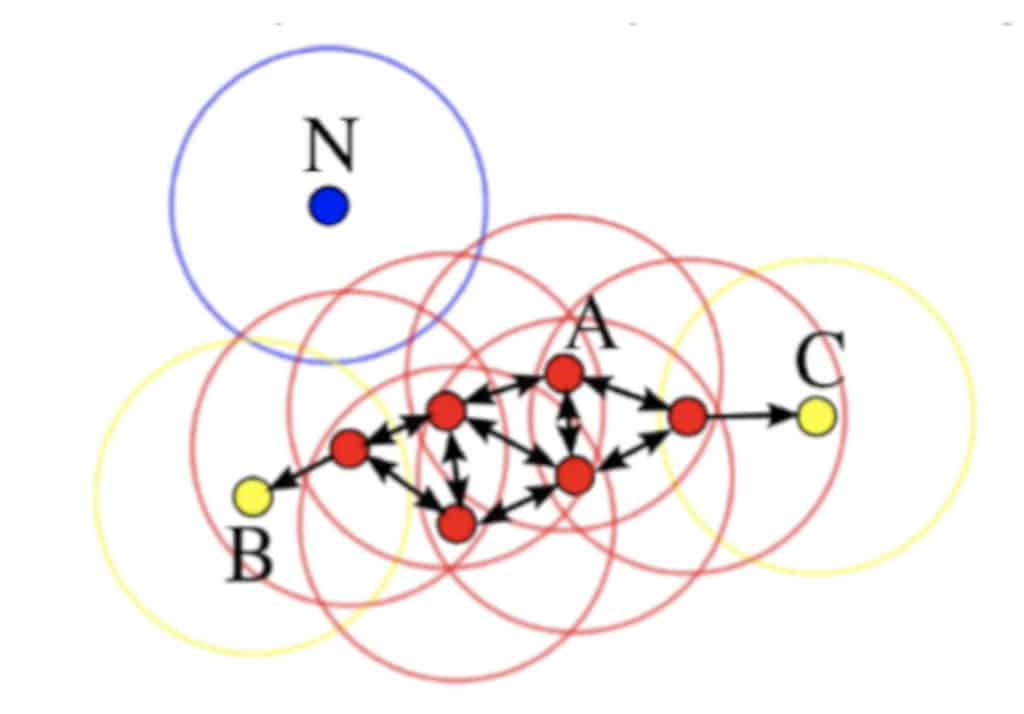
DBSCAN proposes dividing all samples in the dataset into three groups:
- Base samples (red dots) are the samples that have N Base samples in their neighbourhood of radius R (both N and R are hyperparameters that must be defined when you initialize the model)
- Border samples (yellow dots) are the samples that have less than N Base samples in their neighbourhood of radius R
- Noise samples (blue dots) are the samples that do not any any other sample in their neighbourhood of radius R
The general DBSCAN algorithm is as follows:
- Imagine you have a dataset D that you want to use as a training set. As mentioned above you need to set two hyperparameters to initialize a DBSCAN model: R – radius of the neighbourhood (every sample will have the same R), N – number of samples that must be in the neighbourhood to consider a sample as a Base sample
- You need to randomly pick one sample A from D and form its neighbourhood using R (on the first iteration you can choose any sample from the dataset, on the further ones you must choose only those samples you have not checked yet)
- If the neighbourhood of A has more or equal to N samples, A is considered the first Base sample of a new cluster. Otherwise, A is marked as the Noise sample
- Explore all samples from the neighbourhood of A, form and check their neighbourhoods, and mark samples as seen and as Base or Border samples
- Repeat step 3 until you have marked every sample in the cluster
- Repeat steps 2-3 until all samples in D are checked
When performing Outlier Detection using DBSCAN Noise samples are considered to be the outliers. Fortunately, DBSCAN can be easily initialized and implemented using sklearn. Moreover, all Noise samples found by DBSCAN are marked as the -1 cluster. Thus, you can easily access and visualize the outliers. Please access the Notebook for further code.
Still, it is important to remember that the DBSCAN algorithm is very dependent on the hyperparameter initialization as its results can drastically change depending on them. Therefore Outlier Detection using DBSCAN requires an in-depth analysis of the data and the origin sphere of the data.
Minimum Covariance Determinant and Elliptic Envelope
Minimum Covariance Determinant (MCD) is a common Outlier Detection approach that should be used only if your data is Normally (Gaussian) distributed. If so, you will be able to use simple statistical methods to detect outliers. Unfortunately, the algorithm will not work otherwise, so please pay attention to the distribution of your data.
If you know the distribution, you can assume that the closer the sample is to the tail of the mixture of distributions, the more anomalous it is. In other words, you should try to define the “shape” of the data based on the distribution, and consider samples that stand far enough from that initial shape as outliers. To sum up, you need to define a hypersphere (ellipsoid) in the space of your features that covers the normal data. The samples that fall outside this shape should be considered an outlier.
Actually, sklearn has two functions for this Outlier Detection technique: Elliptic Envelope and Minimum Covariance Determinant. It is worth mentioning that these two functions are different in the approach they use to estimate the covariance. MCD uses a robust approach while Elliptic Envelope uses an empirical one. Thus, you can try both of these techniques to see which one you like more. My personal choice is the Elliptic Envelope as it is an easy-to-use algorithm. For further code please refer to the related section of the Notebook.
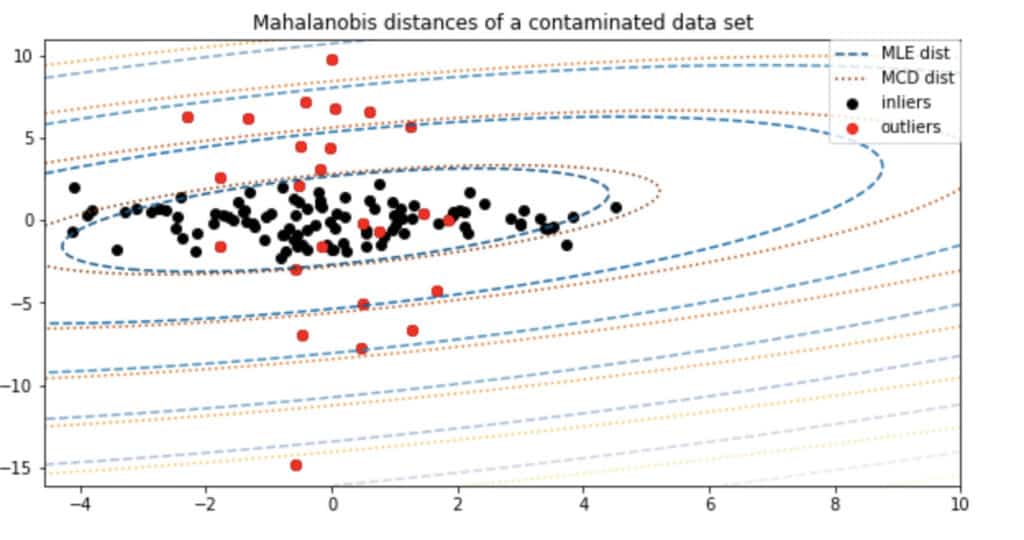
Image source: Notebook
Isolation Forest
Isolation Forest or IForest is a popular Outlier Detection algorithm that uses a tree-based approach. The general concept is based on randomly selecting a feature from the dataset and then randomly selecting a split value between the maximum and minimum values of the feature. Thus, you will be able to isolate and calculate the isolation path for every sample in your dataset. For example, the isolation path for the green dot in the picture below will be 2 whereas for the gray dot it will be 3.
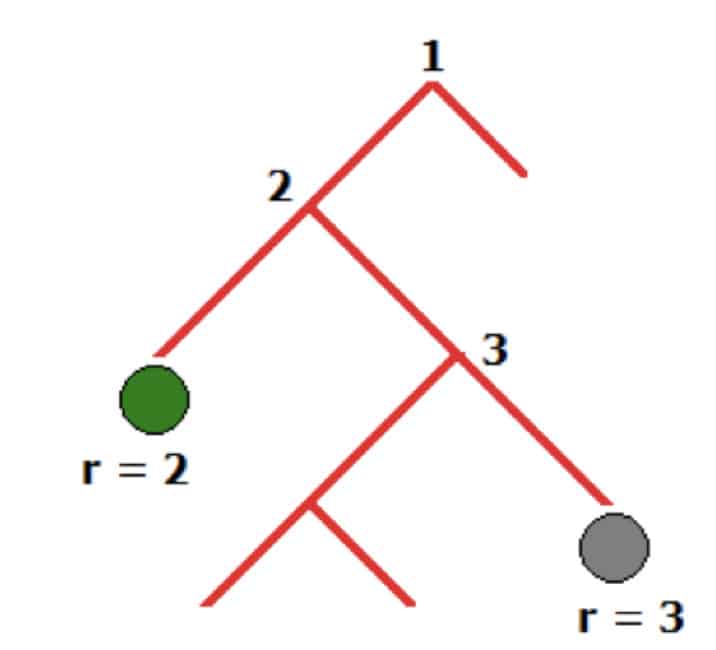
Such randomization guarantees that outliers will have shorter isolation paths. However, you can not be sure you found an outlier based on a single tree. To do that you need to build many trees. That is why IForest just as the name states requires building plenty of trees (Forest) and checking isolation paths of samples. If many trees have a short isolation path for a particular sample, it is likely to be an outlier.
Scikit-learn implementation of Isolation Forest is based on the ExtraTreeRegressor ensemble from the same library. For further code please refer to the related section of the Notebook.
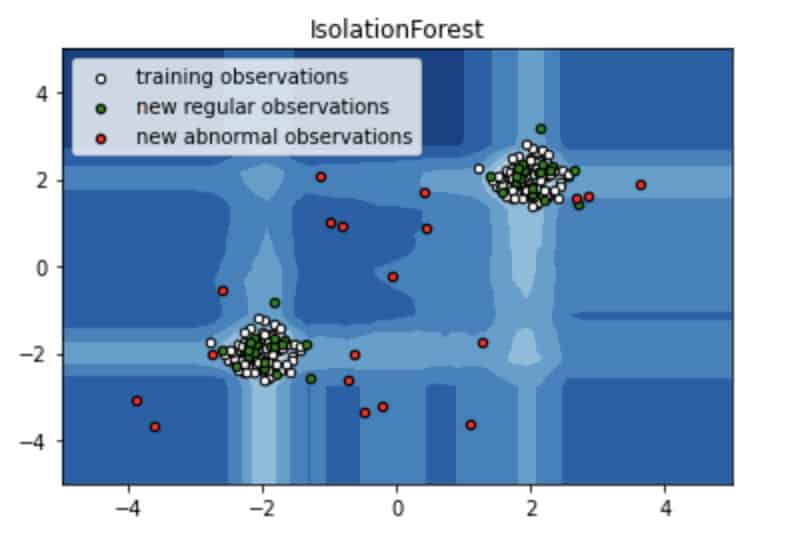
Image source: Notebook
Local Outlier Factor
At first sight, the Local Outlier Factor (LOF) approach might seem pretty similar to DBSCAN. To tell the truth, they definitely have something in common. Both LOF and DBSCAN identify the outliers by locating those samples that are far enough from other samples in the feature hyperspace (both algorithms are density-based). The major difference is that DBSCAN is also a clustering algorithm whereas LOF uses other Unsupervised Learning algorithms, for example, kNN to identify the density of the samples and calculate a local outlier factor score.
The general algorithm is as follows:
- You need to define hyperparameter k – number of neighbors to look out for. Generally, both 3 and 4 are good picks because if k is small the algorithm will become sensitive to noise. On the other hand, if k is large, the algorithm might not recognise local outliers
- Then you need to calculate the Reachability distances (distance might be Euclidian, Manhattan, or any other). Reachability distance between two samples is the maximum of the pair: the distance to the k-neighbor of the second sample in the pair (you look for the farthest neighbor of the second sample) and the distance between the samples in the pair. Thus, you will be able to identify if a sample is grouped with another samples or not
- The next step requires calculating the Local Reachability Density (LRD) for each sample. LRD measures how far you need to go from one sample until you reach another sample or a set of samples.
- You need to sum up all Reachability distances between sample S and its k-neighbors and divide the sum by the k
- After that, you need to inverse the sum. Thus, you will obtain the Local Reachability Density for sample S
- To find the LOF of sample S you need to sum up all the LRDs of k-neighbors, divide the sum by the LRD of S itself, and divide the result once again by k. The final result will be the Local Outlier Factor of sample S. The smaller is the value, the more is the probability of S being an outlier
For further code and sklearn implementation please refer to the related section of the Notebook.
One-Class Support Vector Machine
You might know Support Vector Machine or SVM as a Machine Learning algorithm that can be used to solve Regression and Classification tasks. However, SVM can be also used for the Outlier Detection task. Such an SVM is called a One-Class Support Vector Machine.
The idea behind One-Class SVM is rather simple. The algorithm learns the density of the inliers (the majority class) and classifies all the extremes on the density function as outliers. Unfortunately, One-Class SVM is pretty sensitive to the outliers which means it might underperform in some situations, for example, if the feature space is high-dimensional. That is why you must be careful when using One-Class SVM. Please check the articles dedicated to One-Class SVM to learn more about its hyperparameters that must be tuned in order to handle outliers correctly and prevent overfitting.
One-Class SVM is also a built-in sklearn function, so you will not face any difficulties in using it. For further code please refer to the related section of the Notebook.
Unsupervised Outlier Detection
Every Outlier Detection algorithm mentioned in the “Automatic Outlier Detection Algorithms” section are actually Unsupervised Outlier Detection algorithms. Indeed, as you might have noticed, these algorithms work when there is no information about outliers. Their general concept is to divide all samples into many groups and analyze the size and the structure of these groups.
Clustering-based approach
Still, sometimes you might hear about Outlier Detection using a Clustering-based approach. To tell the truth, this term might refer to different Outlier Detection algorithms and techniques. First, it might be used to describe all Unsupervised Outlier Detection methods simply because dividing the data into groups without having a target value is the general clusterization concept. Second, the Clustering-based approach might refer to using true clustering algorithms as standalone models (DBSCAN, kNN) or in combination with other techniques (Local Outlier Factor). Anyway, it is important to understand that the majority of Outlier Detection algorithms are Unsupervised and can be referred to as Clustering-based.
Outlier Detection as a Classification problem
However, in rare cases, you might face a Supervised Outlier Detection problem. In this scenario, you will have a dataset labeled for inliers and outliers. Thus, you will face a familiar binary Classification problem and will use any Classification algorithm that you find appropriate.
Unfortunately, such datasets will have a strong class imbalance with outliers being a minority class. So, to successfully solve the task you will need to overcome this problem by augmenting the minority class, using undersampling, or another technique to balance your classes.
Outlier Detection in Time Series
Outlier Detection when working with Time Series is a bit different from the standard approaches. To start with, in the Time Series all outliers are usually divided into two groups: point and subsequence (pattern) outliers. Point outliers are single abnormal samples whereas pattern outliers are the clusters of continuous data that are abnormal.
For point outliers, it is rather simple. To start with, you can use any Unsupervised Outlier Detection algorithm as they tend to work really well for such outliers. Also, you may use exponential (is good in seasonal data with no trend) and convolutional (is good for random walks Time Series) smoother. These algorithms will help to compare real observations with smoothed values. Thus, you will be able to find samples that might be considered the point outliers.
As for detecting the pattern outliers, it is likely to be quite challenging as it requires both identifying the normal pattern and comparing the abnormal one to historical data. The key idea is to find a continuous set of samples that are collectively abnormal. Such outliers can be found in the data that have some sort of pattern, for example, seasonal Time Series. To find such outliers you need to decompose the series to detect seasonal and trend components. Using these components and historical data you will be able to identify parts of the series that have abnormal patterns (not seasonal patterns). These parts will be pattern outliers. Anyway, detecting pattern anomalies is a complicated task. Please refer to the related article to learn more.
Overall, if you ever need to detect outliers in Time Series, please do some research on the topic and check the related literature. Also, you should keep in mind that the methods themselves are not as easy to implement. That is why Outlier Detection in Time Series might be expensive time-wise.
How to handle Outliers?
Unfortunately, identifying the outliers is not the only challenge you might face while performing Outlier Detection. Even if you know every outlier in your data, you will need to do something to overcome this problem. Handling the outliers is not a trivial task as it strongly depends on the dataset, the number of outliers in the dataset, the sphere of the study, your Machine Learning task, and your personal attitude to the outliers. Anyway there are basic techniques that will help you to remove or handle the outliers:
- You can simply remove every outlier from your data. However, this method is useful only if you have a small percent of the outlier samples in your dataset. Otherwise, you take a risk of losing a lot of observations
- You can try to assign a new value to an outlier. This method is used when it seems that an outlier occured in the data due to some mistake. For example, all features in a sample except one have adequate values. If so, you can assign a new value to this feature, for example, using mean value among the feature or some other technique
- Come up with something you consider useful. For example, you can somehow transform your data and check the transformation for the outliers. Maybe you believe that all Outlier Detection algorithms you used are wrong, your data has no outlier due to the sphere specifics, and you do not need to do anything. Please explore the data, the sphere, and the opportunities as the deeper you dive into the task the better.
How to get started with studying Outlier Detection?
As you might have already noticed over the course of this article, Outlier Detection is not something you need to study before you start using it effectively. In general, for simple Machine Learning projects knowing some algorithms and how to implement them in Python should be enough. Still, if you want a deep dive into the topic, you should definitely check some additional literature.
Here are some recommended resources on outlier detection that can help advance your knowledge:
- PyOD documentation – deep dive into the examples and the referenced articles
- Scikit-learn documentation – learn more about Outlier Detection algorithms implementation in Python
- Scikit-learn Outlier Detection algorithms description
- Articles dedicated to one particular Outlier Detection algorithm: Isolation Forest, Minimum Covariance Determinant, Local Outlier Factor, DBSCAN and others
- Articles about the advanced Outlier Detection techniques
- Outlier Analysis book
- Check Kaggle. There might be something interesting (there are plenty of valuable tutorials)
- Simply Google your task. It is likely you will find something similar
Final Thoughts
Hopefully, this tutorial will help you succeed and detect all the outliers in your data while performing EDA for your next Machine Learning project.
To summarize, we started with the definition of an outlier, compared outliers, and anomalies, and talked about the types of outliers. Then, we covered many Outlier Detection algorithms. Also, we talked about viewing Outlier Detection in a non-standard way, for example, as a Classification problem. Lastly, we mentioned how to get rid of outliers, and some additional literature that will help you to dive deep into the topic.
If you enjoyed this post, a great next step would be to start exploring some data trying to find outliers using all the relevant algorithms. Check out tools like:
For extra support, you can access the Notebook for further code and documentation.
Thanks for reading, and happy training!